Driving trends for a smarter, safer Christmas and New Year’s 2024 Read article


Thanksgiving is a beloved holiday across the U.S., best-known for quality time with loved ones and a mouthwatering menu with mashed potatoes, bread rolls, pie, and most renowned – the turkey 🦃 In addition to the day-after food coma, Thanksgiving is also notorious for resulting in some of the busiest travel days of the year.
To help ease the stress, our team delved into our U.S. driving behavior dataset, which now consists of more than 45M connections to U.S. drivers. We looked at driving data from 2021 – 2023 to uncover need-to-know insights for upcoming Thanksgiving trips. Here’s what we found:
Quick stats! On Thanksgiving Day:
- High speed (80+) driving increases 78%
- Distracted driving decreases 16%
- Hard braking decreases 19%
Percentage changes are compared to the annual averages for the corresponding day of the week.

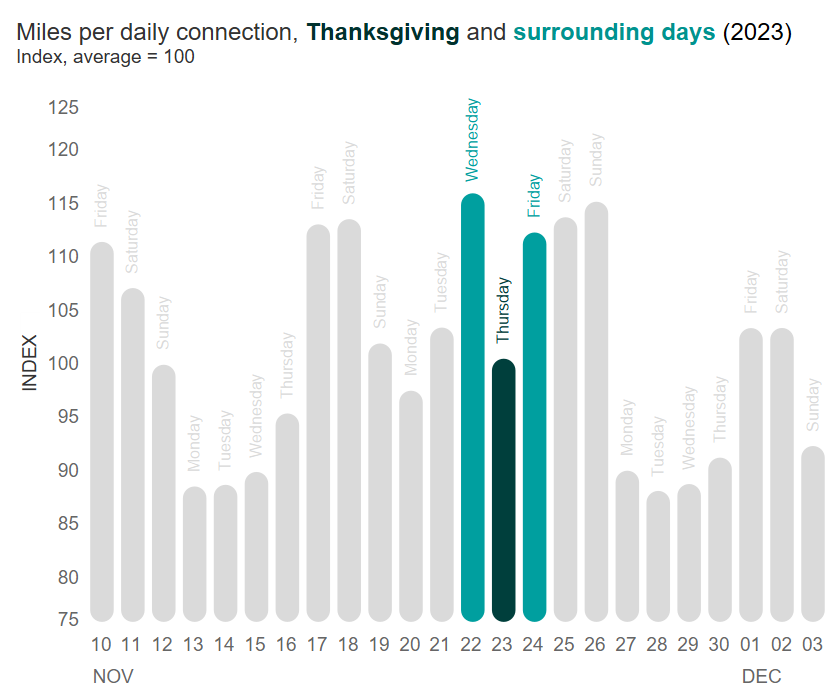
Do you like to squeeze in extra time with loved ones by traveling ahead of Thanksgiving Day? It seems like most people have the same idea with a significant increase in traffic the Wednesday directly before the holiday, which is a consistent trend year-over-year.
Additionally, over the years, the Sunday after Thanksgiving sees more traffic than “normal” – i.e., compared to the average of all Sundays throughout the year. Based on these patterns, it’s likely that people are traveling to their destination ahead of the holiday and then staying through the weekend before heading back home.
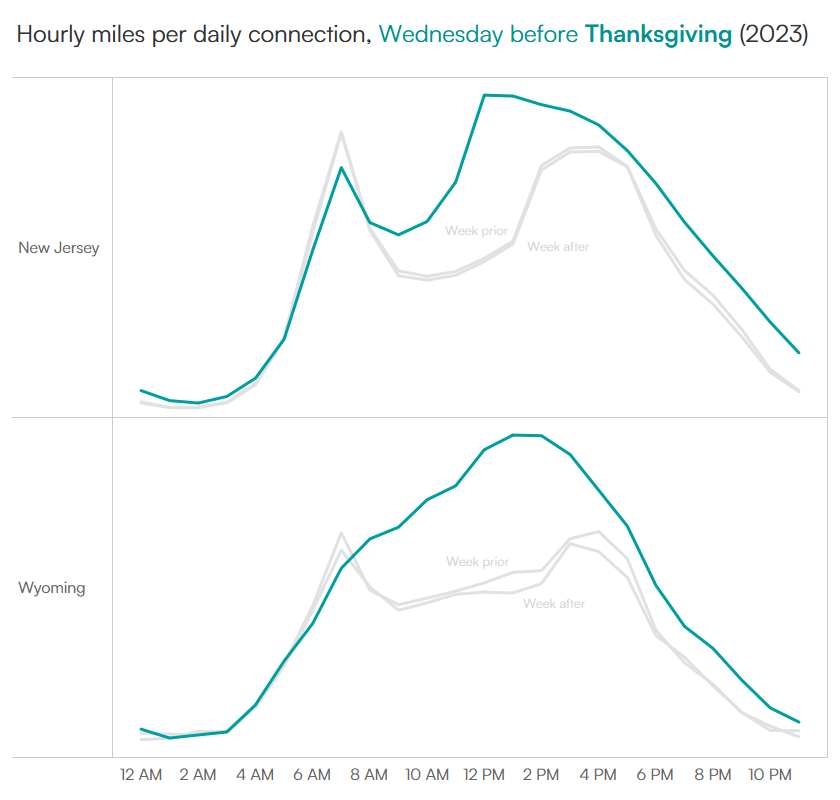
While those travel patterns are what we see on a countrywide level, we see nuances when we dive deeper to look at the state-by-state trends – and what we found is that people hit the road at different times depending on where they live.

To illustrate, in New Jersey we see that travel patterns the Wednesday before Thanksgiving look similar to a regular weekday compared to Wyoming. While there’s still a clear commuter curve in New Jersey, it looks different than the normal trend around noon which could indicate people are deviating from their regular, weekday routines – for instance, some may be taking a half day off work. On the other hand, in Wyoming, there is no commuter curve, which could mean people are already taking time off and traveling throughout the day.
These patterns could suggest that people in New Jersey tend to travel locally for the holiday, while those in Wyoming tend to hit the road earlier to visit relatives who live further away.

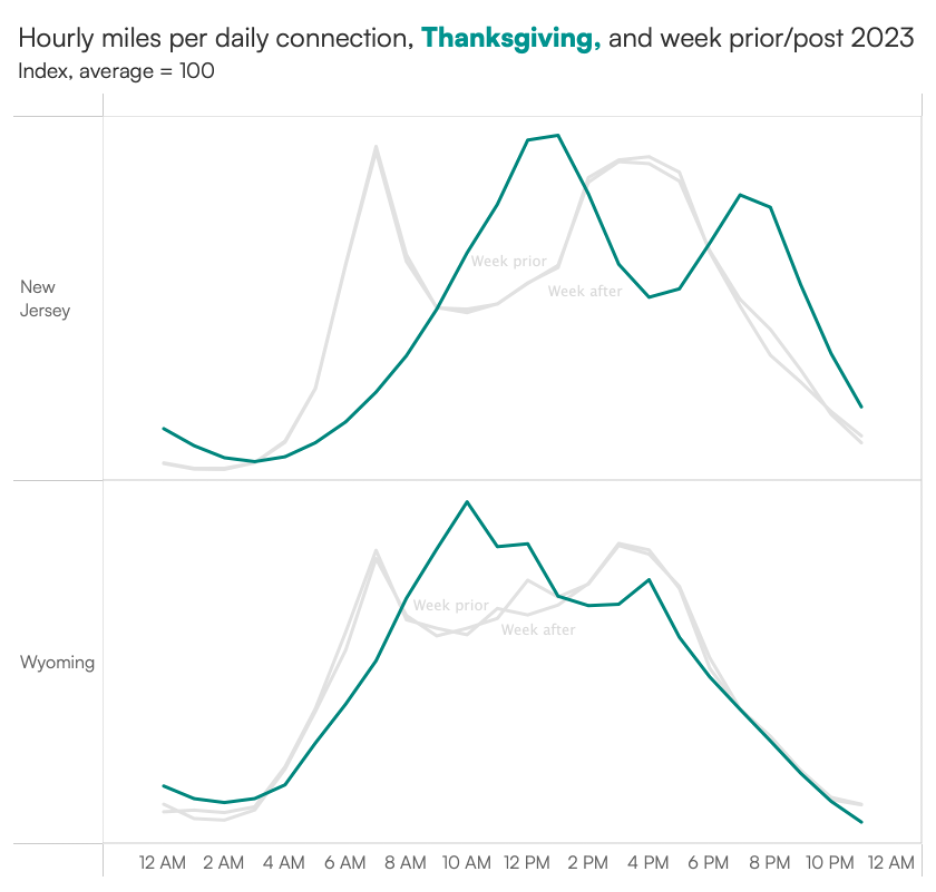
Then on the holiday itself, New Jersey sees delays for when the normal morning and afternoon peaks occur, with more drivers on the road later in the morning and fewer during the typical afternoon rush. The morning peak is also delayed for Wyoming, but there is not the same distinct pattern of traffic reduction and return as we see on normal Thursdays.

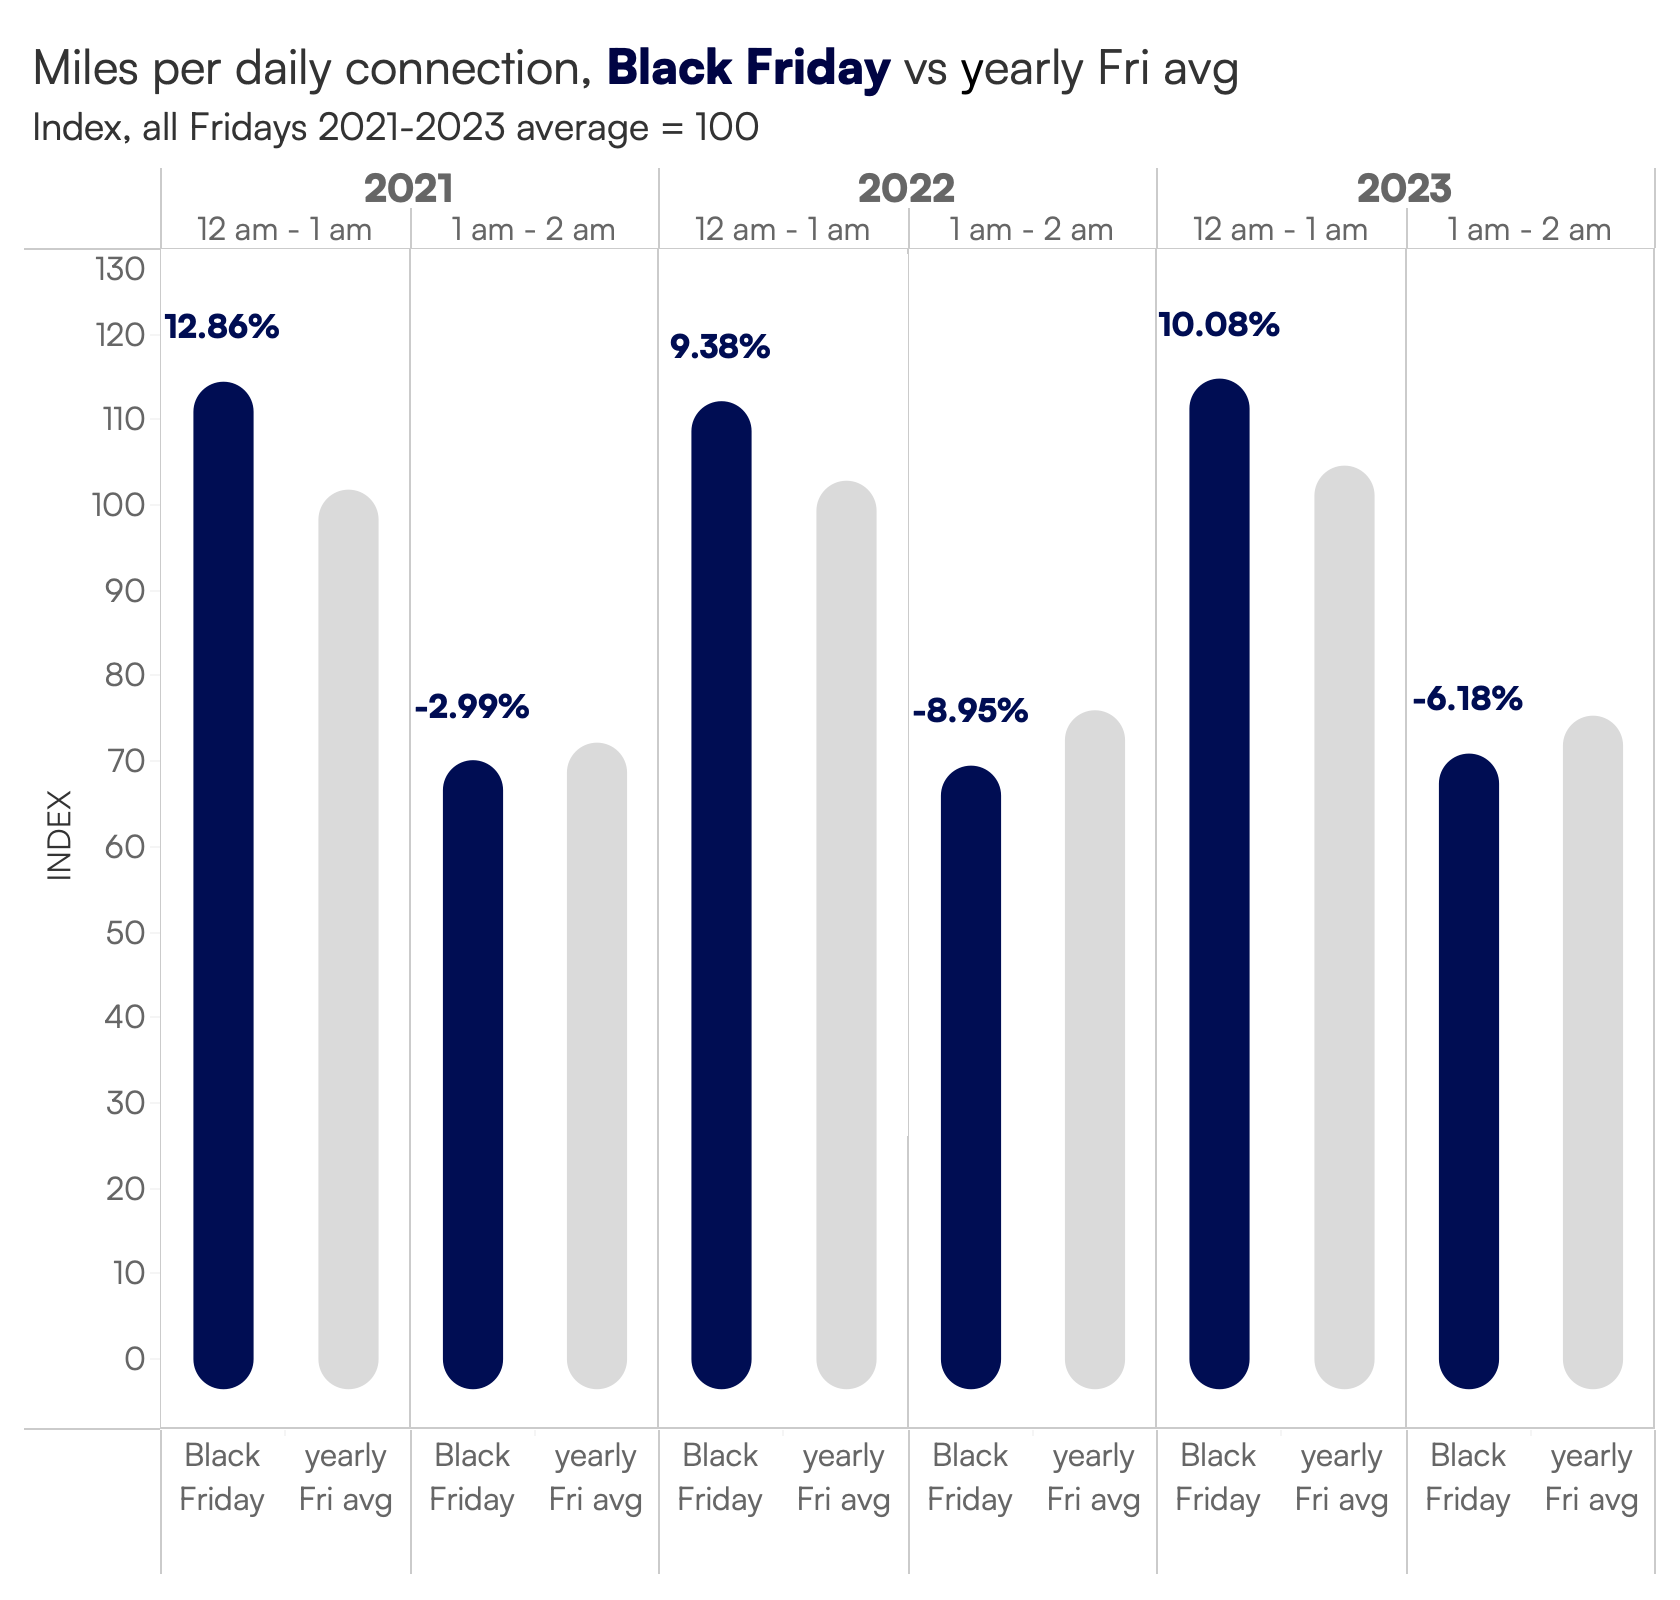
On Black Friday, we see an increase in traffic between midnight and 1 a.m. Throughout the rest of the day, the roads mimic weekend travel patterns, which is atypical compared to other Fridays. However, this isn’t surprising considering 43% of employees have a paid day off.
Since 2021, overall driving on Black Friday has decreased. This trend is also somewhat expected since more and more consumers are ditching in-store shopping for online shopping. We can potentially expect there to be less drivers on the road this year, considering 75% of consumers plan to shop online (rather than in-store) for Black Friday – which is a 7% increase compared to 2023.
As a mobility data and analytics company, it’s our mission to turn raw data into predictive insights that help make transportation smarter, safer, and more useful for everyone. As always, we hope drivers use these insights to plan ahead, avoid traveling during peak traffic, and be extra cautious of risky driving behaviors – especially high-speed driving on Thanksgiving Day!
Arity’s multi-source dataset with more than 45 million active connections includes anonymized and aggregated driving behavior data collected through consumer mobile apps and insurance telematics programs.
Because the data is from multiple insurance and non-insurance sources and is not solely reflective of any Arity affiliate companies or any other particular industry or source, we really get a sense of how people are moving, where they are going, when, and how. Arity is connected to millions of U.S. drivers, so we have a credible representation in every state and demographic (e.g., families, single vehicles, rural, cities).
Keep in mind that although a majority of the trips Arity collects are personal trips, we have the capability to decipher between personal trips, gig driving, and non-driving impacts.
Because Arity collects various driving behaviors within a trip, we can evaluate trends such as speeding, braking, acceleration, phone handling, and the time of day someone drives. Additionally, fueled by the largest telematics dataset tied to auto insurance claims, we can more accurately predict the impact of shifting trends in the dangerous driving behaviors that we described in this report.
Want to learn more about driving trends in the U.S.? Download our latest data report.