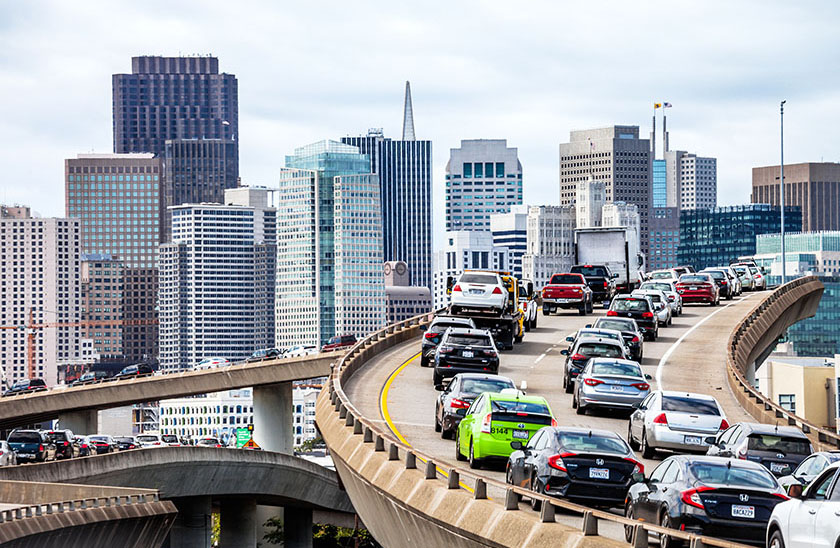
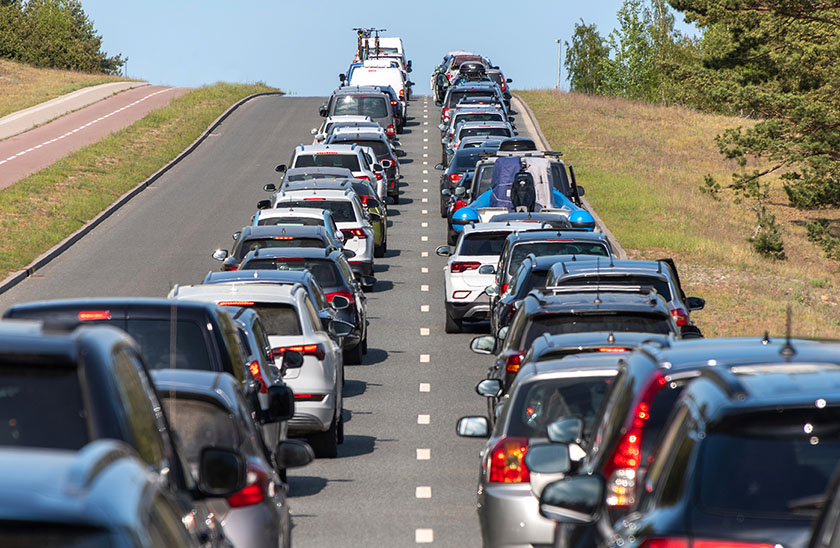
Predicting World Cup 2026 traffic
What mobility data reveals about congestion, risk, and travel demand
Learn how mobility data reveals World Cup 2026 traffic patterns, congestion risks, and travel demand across four major host cities and venues.
Leverage our mobility intelligence solutions to help inform crucial decisions for road safety and infrastructure projects.
An estimated 60% of property-damage-only crashes and 32% of injury crashes are not reported to law enforcement. – The National Highway Traffic Safety Administration (NHTSA)
Learn how mobility data reveals World Cup 2026 traffic patterns, congestion risks, and travel demand across four major host cities and venues.
Safety Hub, a platform that provides a more comprehensive and current understanding of roadway risk, can help agencies reverse these numbers and make transportation safer in their communities.