Arity wins 2026 Top 100 Inspiring Workplaces awards Read article

It’s no surprise that travel patterns will shift on a major holiday like July 4th, but when the timing changes each year and local events affect road conditions in unique ways, those patterns can become harder to anticipate.
Using Arity Road Traffic Analytics and telematics data connected to more than 50M+ U.S. drivers, our analysts looked for insight into driving patterns and behaviors to understand how travel behavior shifts — and what that means for road conditions and consumer demand on America’s 250th birthday weekend.
Here’s what Arity’s mobility data suggests about how Americans move on the July 4th holiday — and what we might see in 2026.
Four key trends to pay attention to:
In each of the last three years, the busiest day in the travel window was not July 4th itself. Instead, driving peaked before or after the holiday, depending on where the holiday fell during the week.
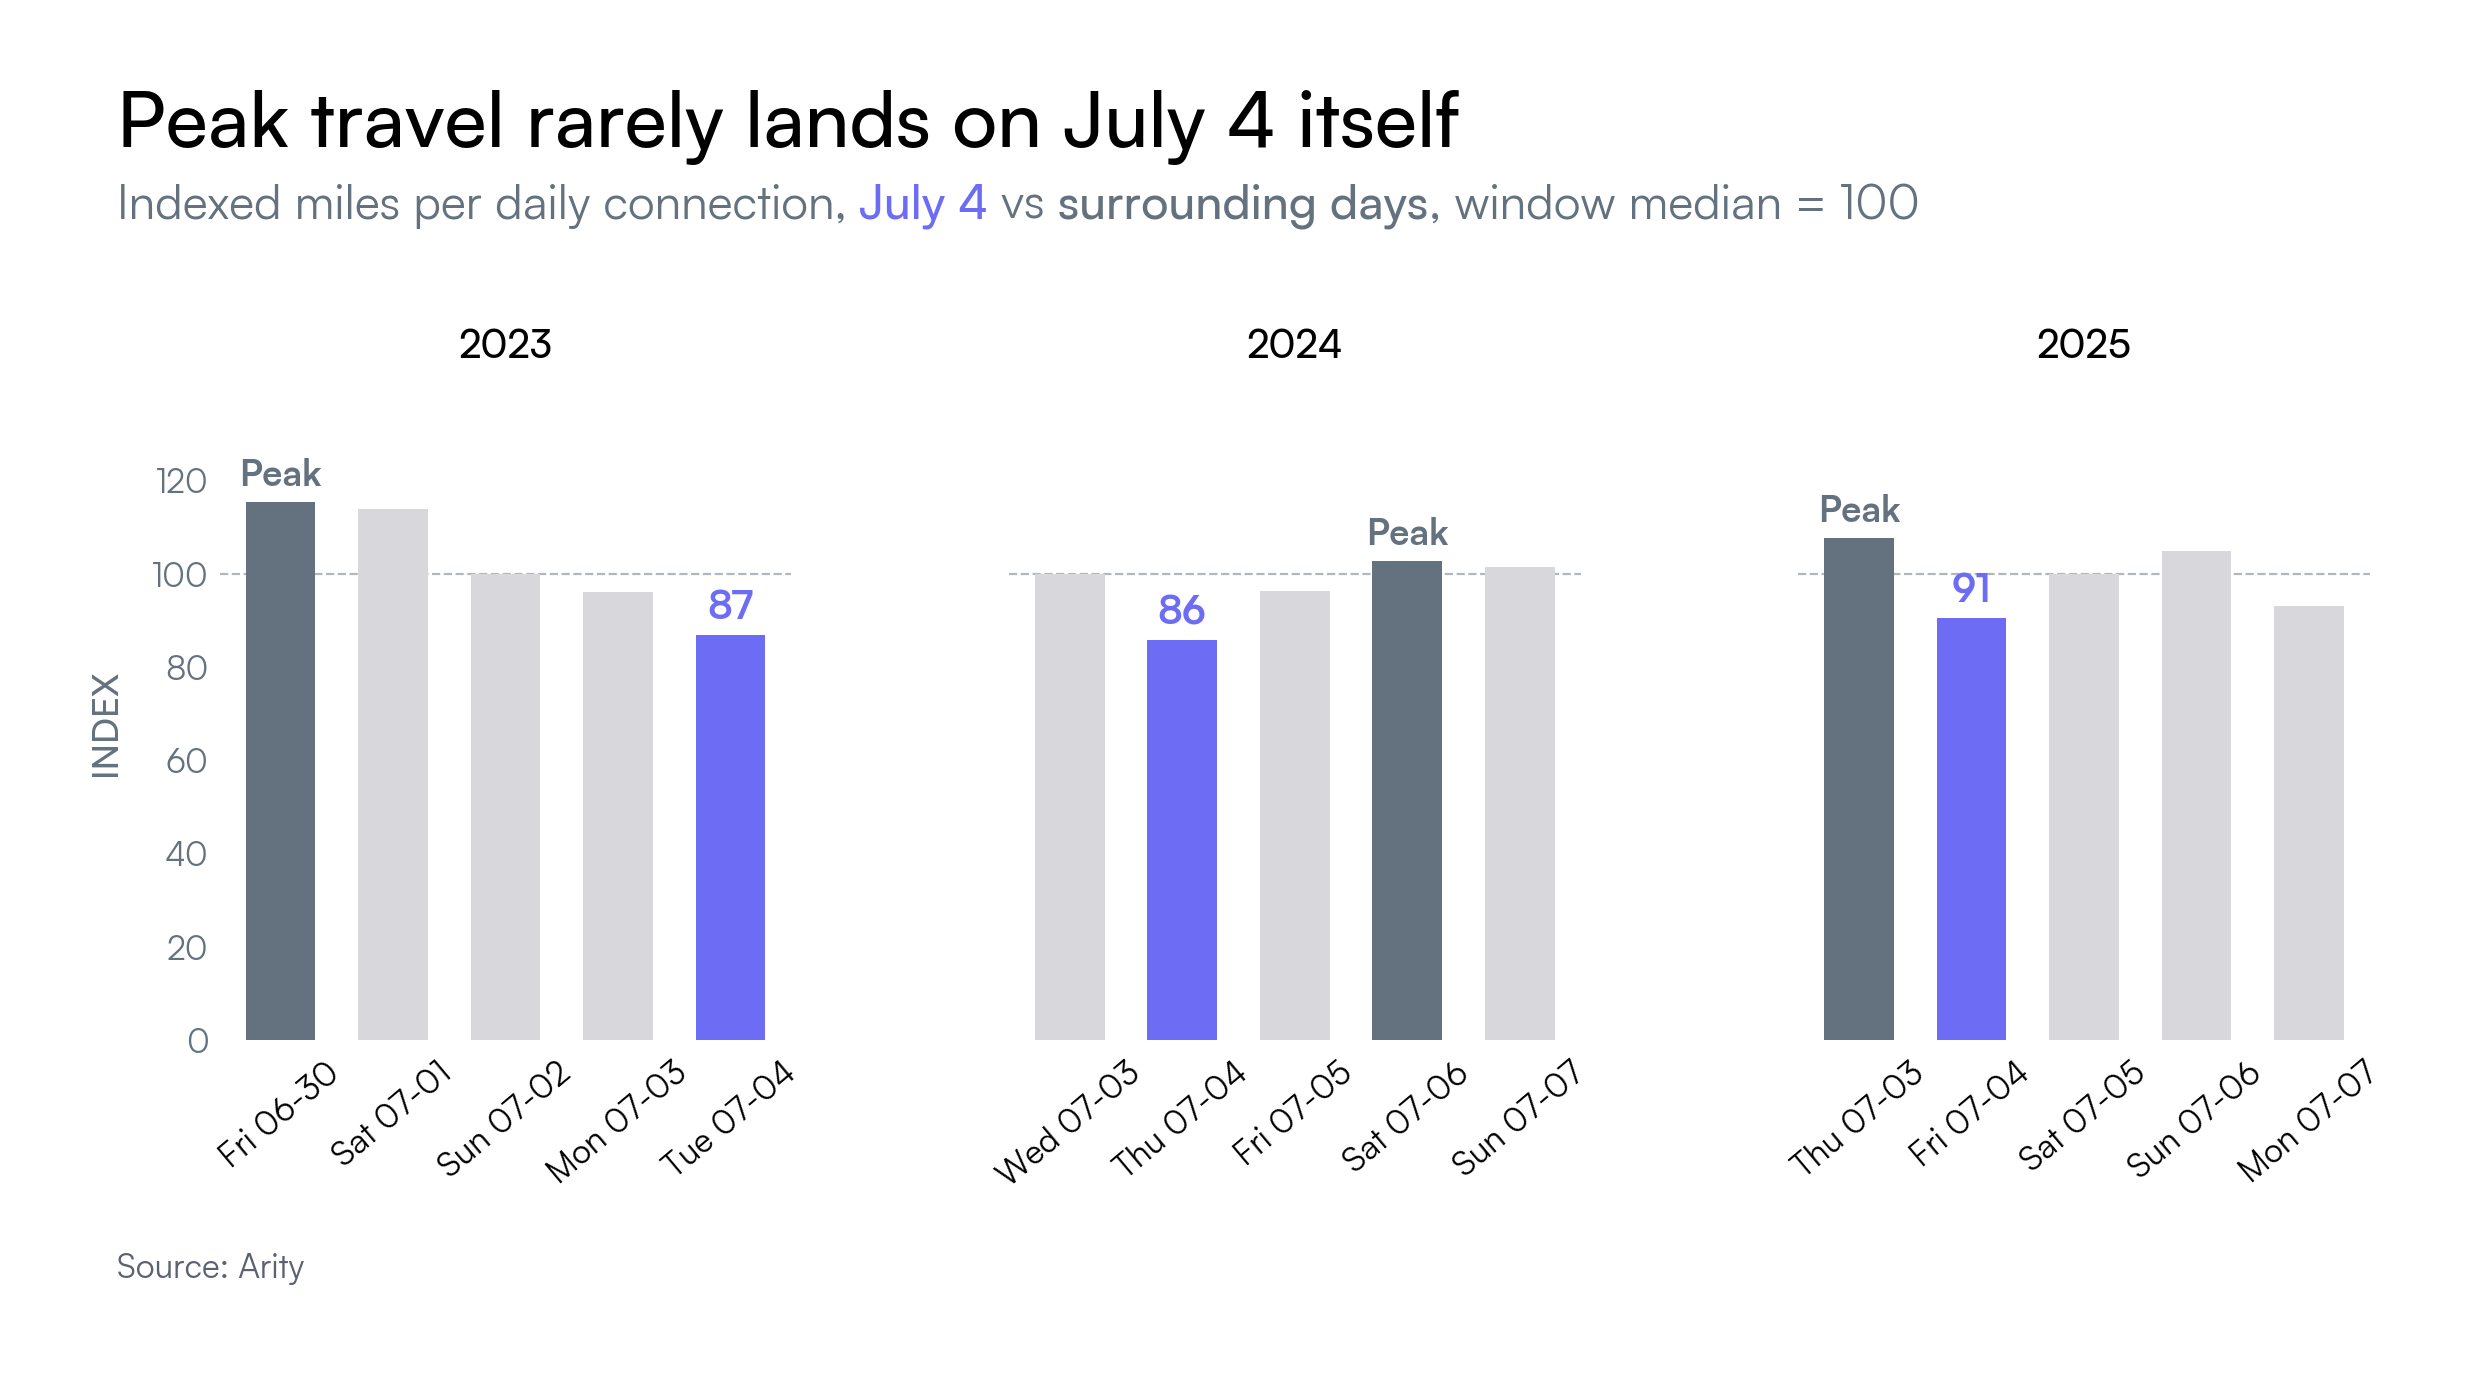
On average, July 4th driving is about 19% below the peak day in the same travel window.
That pattern reflects how people move during the long weekend:
For 2026, that pattern is expected to follow a similar shape. With July 4th falling on a Saturday. Friday (July 3) may see higher outbound travel, while Sunday (July 5) may reflect return trips.
Takeaway: The busiest travel periods may occur before and after July 4th, rather than on the holiday itself.
People often drive less on July 4th when compared to a non-holiday, but the driving that does occur may be more concentrated and dynamic. Compared to peak travel days:
The result is a shift from long‑distance travel to more dense, local movement patterns on July 4th itself. These conditions can make smaller disruptions more noticeable.
Takeaway: Even with lower overall travel volume, July 4th conditions can feel more congested locally, as shorter, frequent trips create denser traffic patterns.
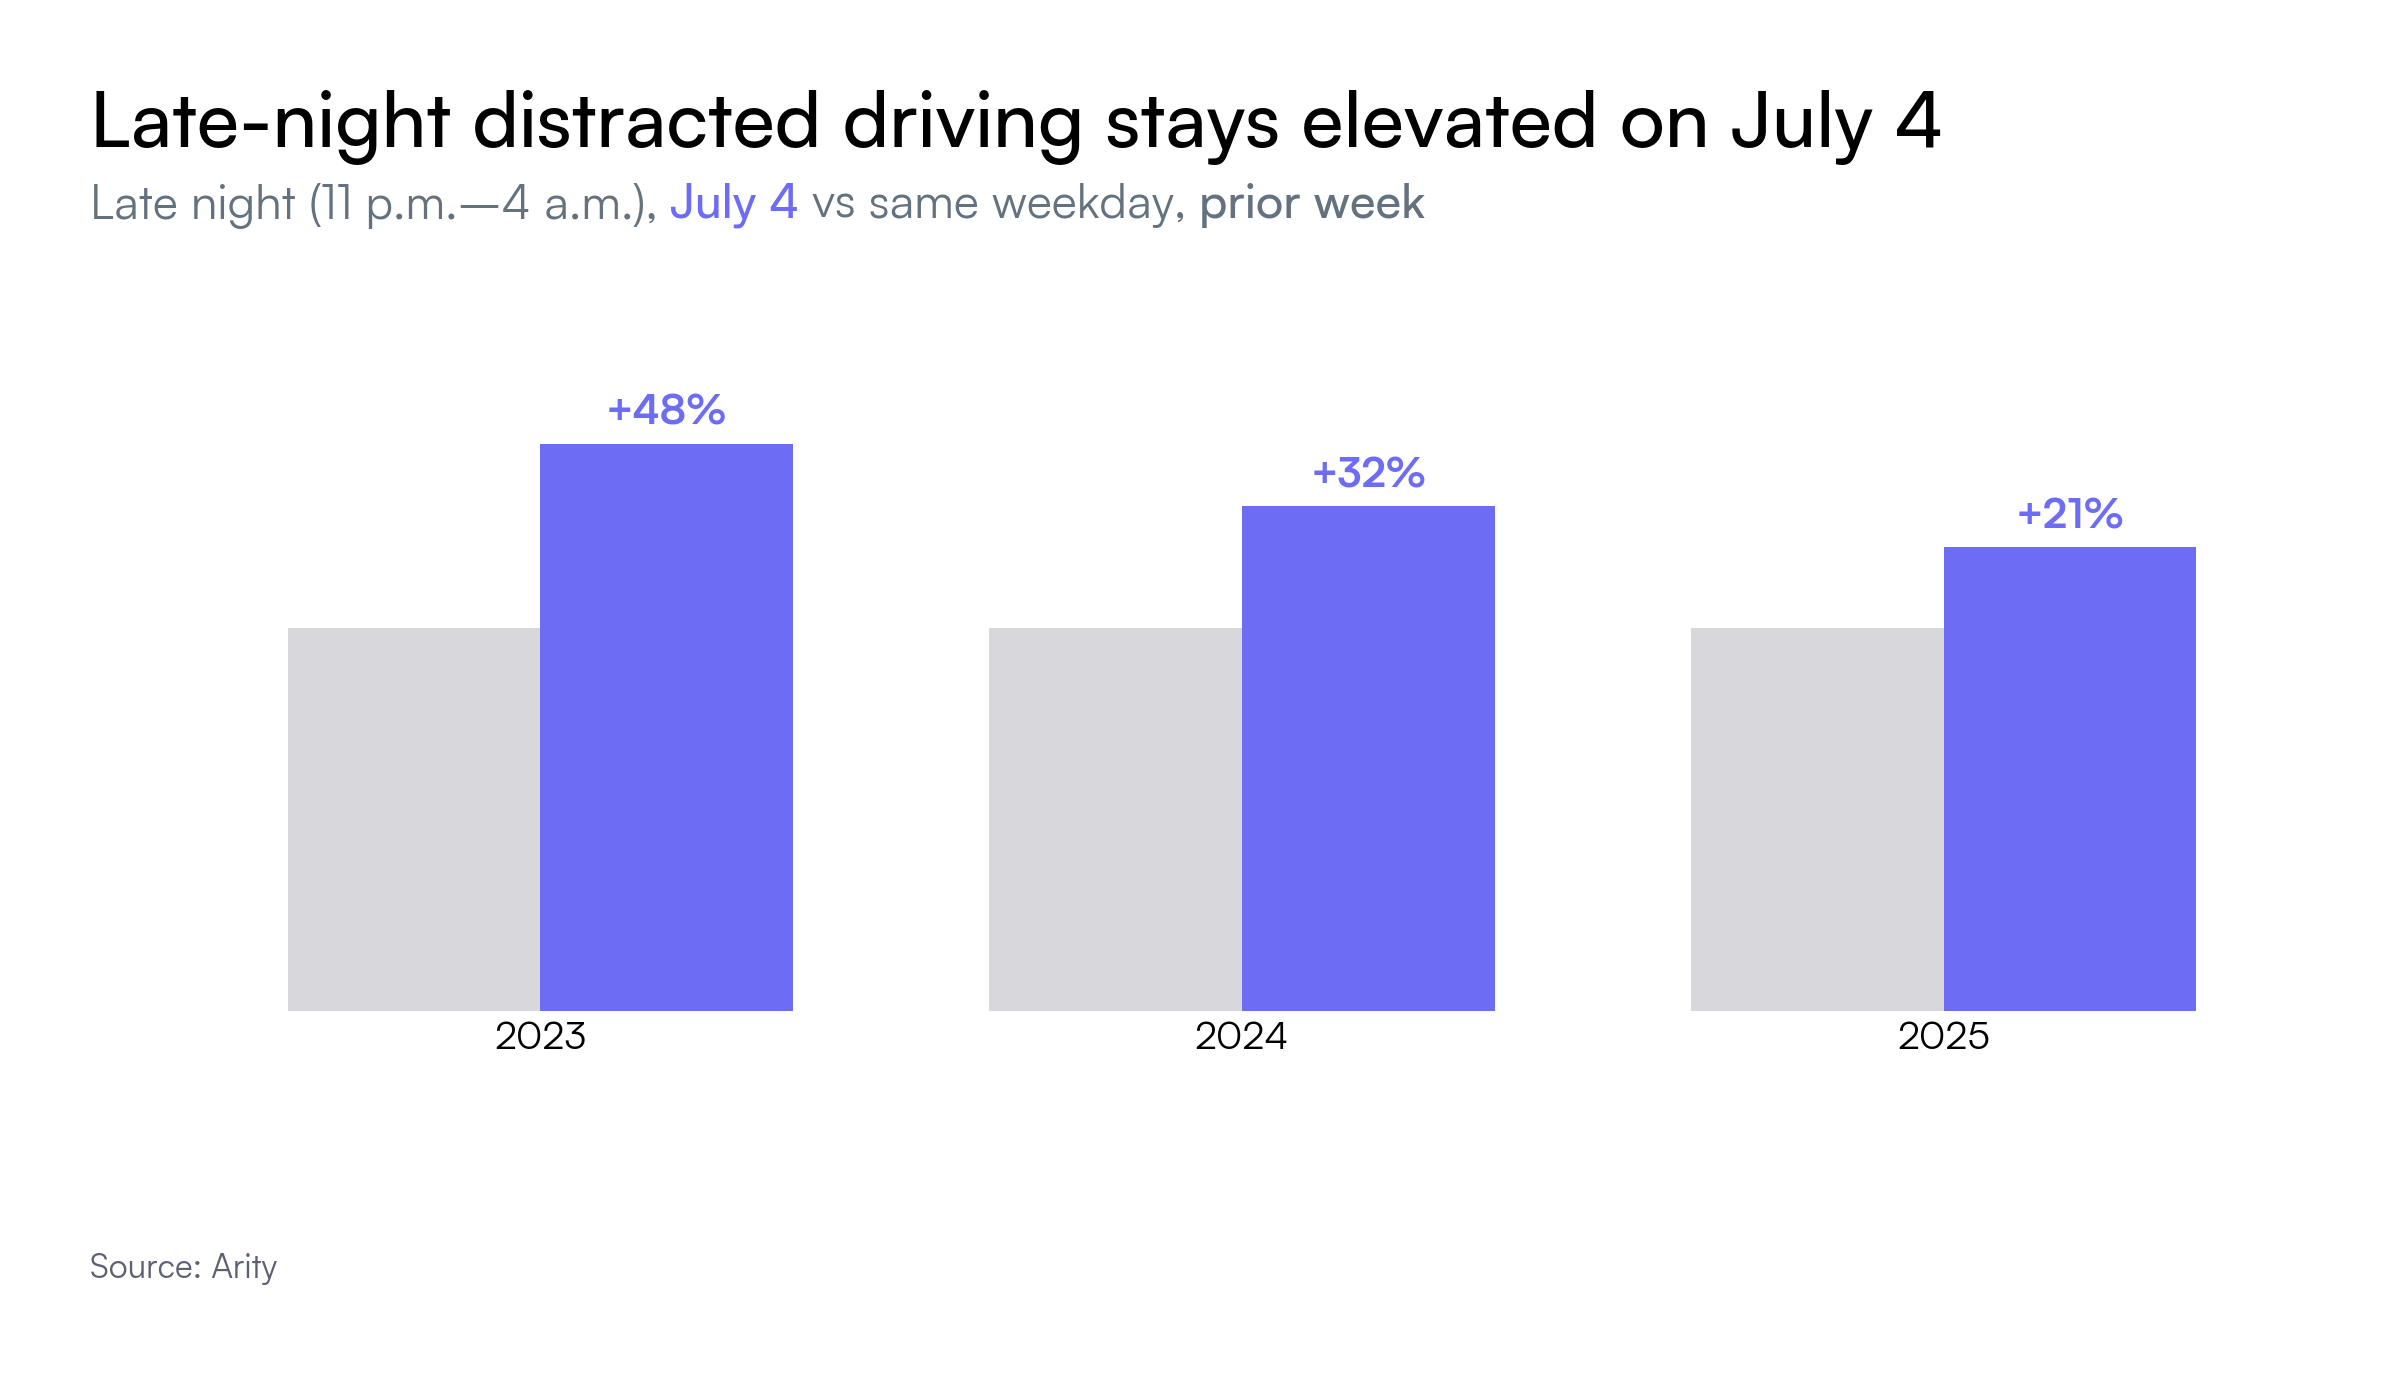
Late-night phone use on July 4th remains higher than the non-holiday baseline in recent years, though the gap is narrowing. Distraction was +48% in 2023, +31% in 2024, and +21% in 2025 when compared to the same regular weekday.
At the same time, historical crash datasets indicate that fatal crashes increase during the July 4th travel window, particularly after dark, with 16% more fatal crashes in the evening and 47% more during the late-night period over the holiday weekend when compared to a normal week (FARS, 2019-2023).
Taken together, behavioral signals and crash outcome data suggest that evening driving conditions become more complex, with overlapping behavioral and environmental factors.
Takeaway: Late‑night July 4th travel may involve higher levels of distraction and crash risk, as behavioral signals and historical crash data trend upwards after dark.
Which states had the highest and lowest distracted driving rates on July 4th?
On July 4, 2025, drivers in Delaware, New Jersey, and Wisconsin saw among the largest increases in distracted driving compared to a typical day that year. Alaska, Pennsylvania, and Arizona saw the smallest increases, with Alaska essentially unchanged.
National trends only tell part of the July 4th story. For individual drivers, conditions may shift quickly at the local level, where events can reshape how people move around.
Consider a small-town multi‑day festival like Tom Sawyer Days in Hannibal, Missouri. In a typical year, a driver may experience:
On July 4th itself, these conditions can become more pronounced:
In 2026, additional celebrations – the 150th anniversary of The Adventures of Tom Sawyer and the nation’s 250th birthday – may add to overall activity in Hannibal, above and beyond what they typically see. Visitors may arrive in greater numbers, at different times, stay longer, and move between multiple nearby attractions, creating less predictable traffic patterns.
Mobility data can help illustrate how these conditions evolve, showing when congestion builds, where drivers may divert, and how pedestrian-heavy areas influence vehicle flow beyond the immediate event footprint. For example, a street that appears open may still function like a constrained corridor when pedestrian crossings increase.
With the anniversary celebrations layered on top of the usual July 4th festivities, drivers may encounter roadway conditions that differ from expectations.
Takeaway: Local events can significantly reshape traffic patterns, making real‑time context an important factor in understanding congestion. Mobility data can help provide a clearer view of how movement patterns are evolving.
Mobility data gives businesses and municipalities unique insights that complement other data types such as foot traffic, demographics, or sales transactions. These insights can support more strategic decisions and accelerate measurable results.
If you know when your customers are most likely to be driving past your business on this holiday weekend, you can connect them with more timely and relevant offers that may be very welcome during a long drive.
Understanding when traffic patterns will change and which driving behaviors are most likely to occur can help municipal officials get ahead of Fourth of July with targeted road safety and traffic interventions.
Arity used its mobility dataset of more than 50 million anonymized active U.S. drivers representing every state on all types of roads. Our data analysts compared the 2025 July 4th holiday week with the previous non-holiday week, then reviewed those results year-over-year and at a state level.