New Year’s Eve driving behavior trends 2025 Read article


One fun fact about Arity is we have collected nearly 2 trillion miles of driving data since inception. To put it simply, that’s a lot of data. And if you don’t already know, that data is sourced from more than 45M connections to U.S. drivers – a lot of which comes from our partnerships with consumer mobile apps.
We use a software development kit (SDK) to collect mobile phone sensor data, so that we can provide valuable features to app users – for example, crash detection which ensures drivers get help when they need it most.
Along with GPS, the accelerometer and the gyroscope are two of the most useful sensors for us at Arity. That’s because these sensors generate data that provide a comprehensive understanding of a vehicle’s motion along with how it is being controlled by the driver.
An accelerometer measures 3D acceleration. Sounds obvious, but if you took intro physics and can still remember, acceleration is how fast velocity changes over time. And velocity is a vector, which means it has both magnitude (AKA speed) and direction.
With an accelerometer reading, we can look at:
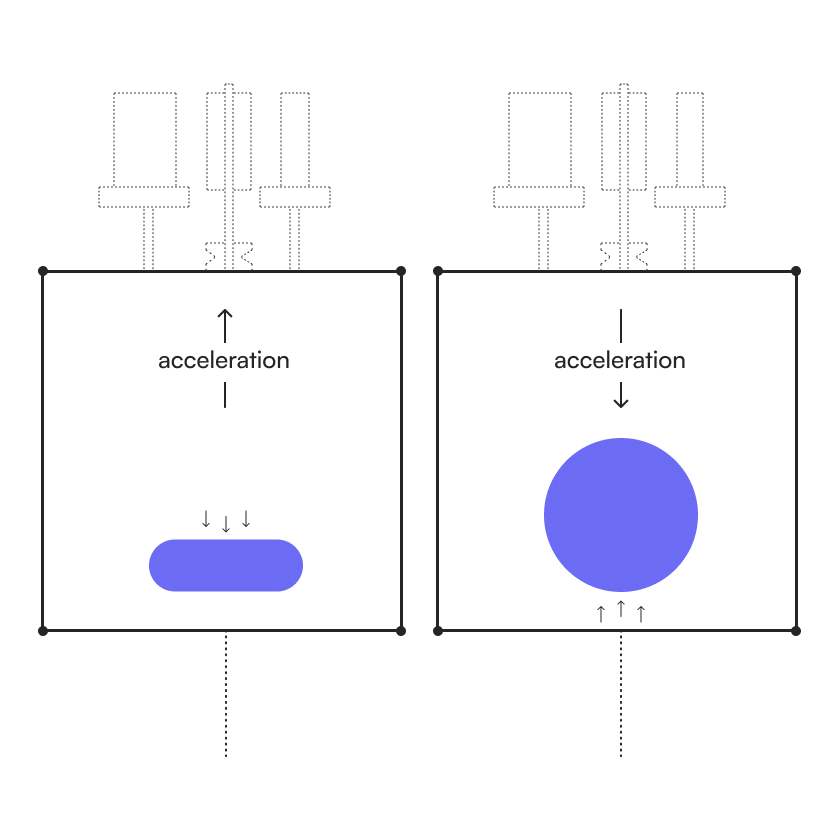
So, how do you measure acceleration? Let’s say you’re in an elevator. How do you know when you’re accelerating upward? This happens when you start going up, or when you stop going down. You can probably imagine how this feels – you feel heavier. You’re pushing down on the floor harder, and the floor is having to push you up with more force in return.
And how do you know when you’re accelerating downward? This is when you start going down, or when you stop going up. This time, you feel lighter. You’re pushing down on the floor with less force, and the floor is pushing you up with less force.

An accelerometer works the same way. The sensor contains a test mass that gets jiggled around, and the outside parts of the sensor try to keep the test mass in place. What the sensor measures is how much force it takes to keep the test mass stable and deduce what the acceleration must be.
Now, you might notice something. When the elevator isn’t moving or when it’s moving at a constant speed, you don’t feel weightless. You still feel the regular effects of gravity – you’re pushing down on the floor, and the floor is pushing you up. Otherwise, you would fall through the floor.
Does this mean when you’re at rest, the accelerometer measures an upward acceleration? The answer is yes! That’s the apparent acceleration due to gravity, which has a measurement of 1g (appropriately 9.8 m/s2 ) in the upward direction. In simple terms, gravity feels like you’re accelerating upward at 1g. In fact, that’s what Einstein said – I’m 100% serious.
What driving data do we extract from accelerometers? Along with detecting car crash impacts, accelerometer data is useful for detecting many other driving events, including braking, turning, lane changes, and acceleration or deceleration in speed.
Analyzing accelerometer data from mobile phones can be tricky because we all place our phone somewhere different while driving – you may keep your phone propped up on a phone holder, but someone else may keep it stored away in their center console.
Without knowing which direction the phone is facing, can we extract any useful data points from accelerometers? One obvious thing we can do is compute the magnitude of the acceleration vector. In fact, the magnitude is the only quantity that you can get from a vector that doesn’t change under rotation, so this is the only thing you can do that makes sense when all you have is a single accelerometer measurement, and you want a quantity that doesn’t depend on which way the phone is facing.
One drawback of using the raw magnitude is the presence of that gravity signal. Let’s say there’s a 1g acceleration in the horizontal direction and the magnitude in the accelerometer measurement is √2g, or about 1.4g. The magnitude doesn’t increase that much even though this is a fairly strong acceleration.
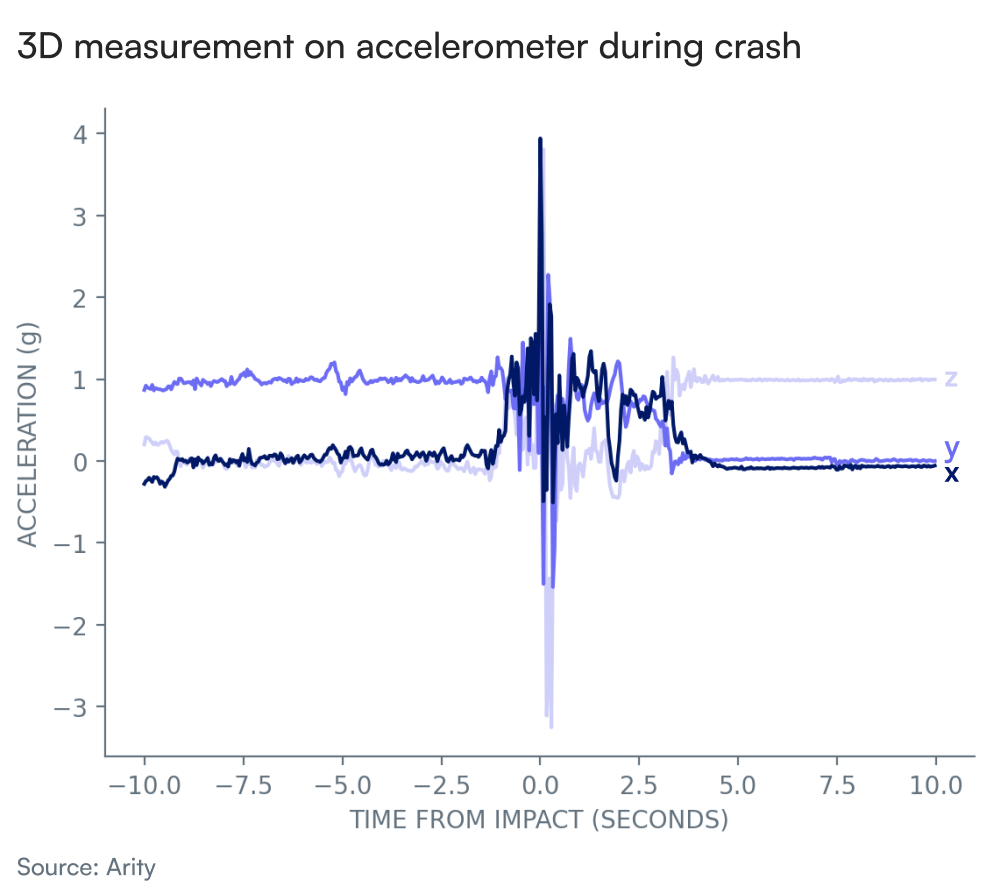
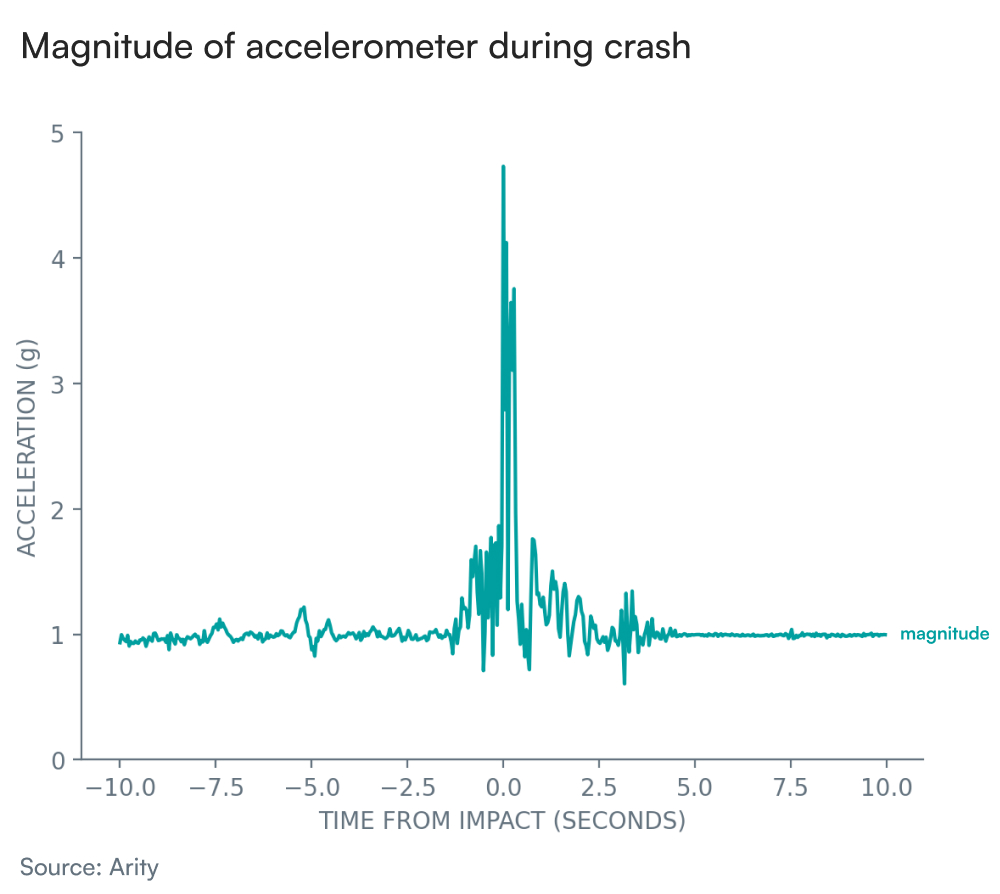
Even so, there are some cases such as car crashes, when the magnitude is enough to tell us something useful. The plots below show the 3D measurement on the accelerometer during a crash, as well as the accelerometer magnitude for the same crash. From the 3D measurement plot, you can see the big spike that went above 2g in all 3 axes, and that there were some things happening for a few seconds before and after the spike. Unless you have practice looking at these plots, it’s hard to get more than that.


When you look at the magnitude plot, you see that the acceleration magnitude increased to almost 2g, about 1 second before the main impact, possibly indicating evasive action. What happened after the big spike looks like a slow wind down, where the phone is slowly coming to rest somewhere inside the vehicle.
In order to get more information out of accelerometer data, we can estimate the direction of gravity. For example, if the phone is not moving around inside the car, taking the average of the accelerometer signal over a few seconds should usually give us a good estimate for the gravity signal. This is vertical axis alignment, where we try to figure out which direction the phone is facing with respect to the vertical axis.
If we know the vertical direction, we could subtract out the gravity vector, which again is 1g in the up direction. This gives us something closer to the true acceleration of the phone. This would be a better signal to use when we want to figure out what’s happening.
Of course, we need to be careful here because any estimate of the vertical axis would have errors, and the phone orientation can change during a trip, making the previous estimate of the axis simply wrong.
We can do a full axis alignment, where we also know which way the car is facing. This could let us know if the user’s car was hit from behind, or from the right side, etc. In order to achieve this, we need to bring in other data sources like GPS and the gyroscope.
Ready to learn more? Check out our Crash Detection by Arity case study and stay tuned for my next post, “What driving data can we collect from gyroscopes?”