New Year’s Eve driving behavior trends 2025 Read article


We all know what July 4th looks like – it’s hanging out poolside and eating popsicles by day, then sitting out and watching firework or drone shows by night. But with kids off from school for the summer and many people taking time off from work, what do the roads look like during this hot, summer holiday?
Using our massive dataset with a connection to more than 40M U.S. drivers, Arity’s summer road series (which started with Memorial Day) uncovers driving patterns and behaviors to help everyone travel safely and efficiently throughout the hottest months of the year.
Looking at the weeks surrounding July 4th last year, we found trends around when drivers hit the road and how they got from Point A to Point B. Here are three things to know.
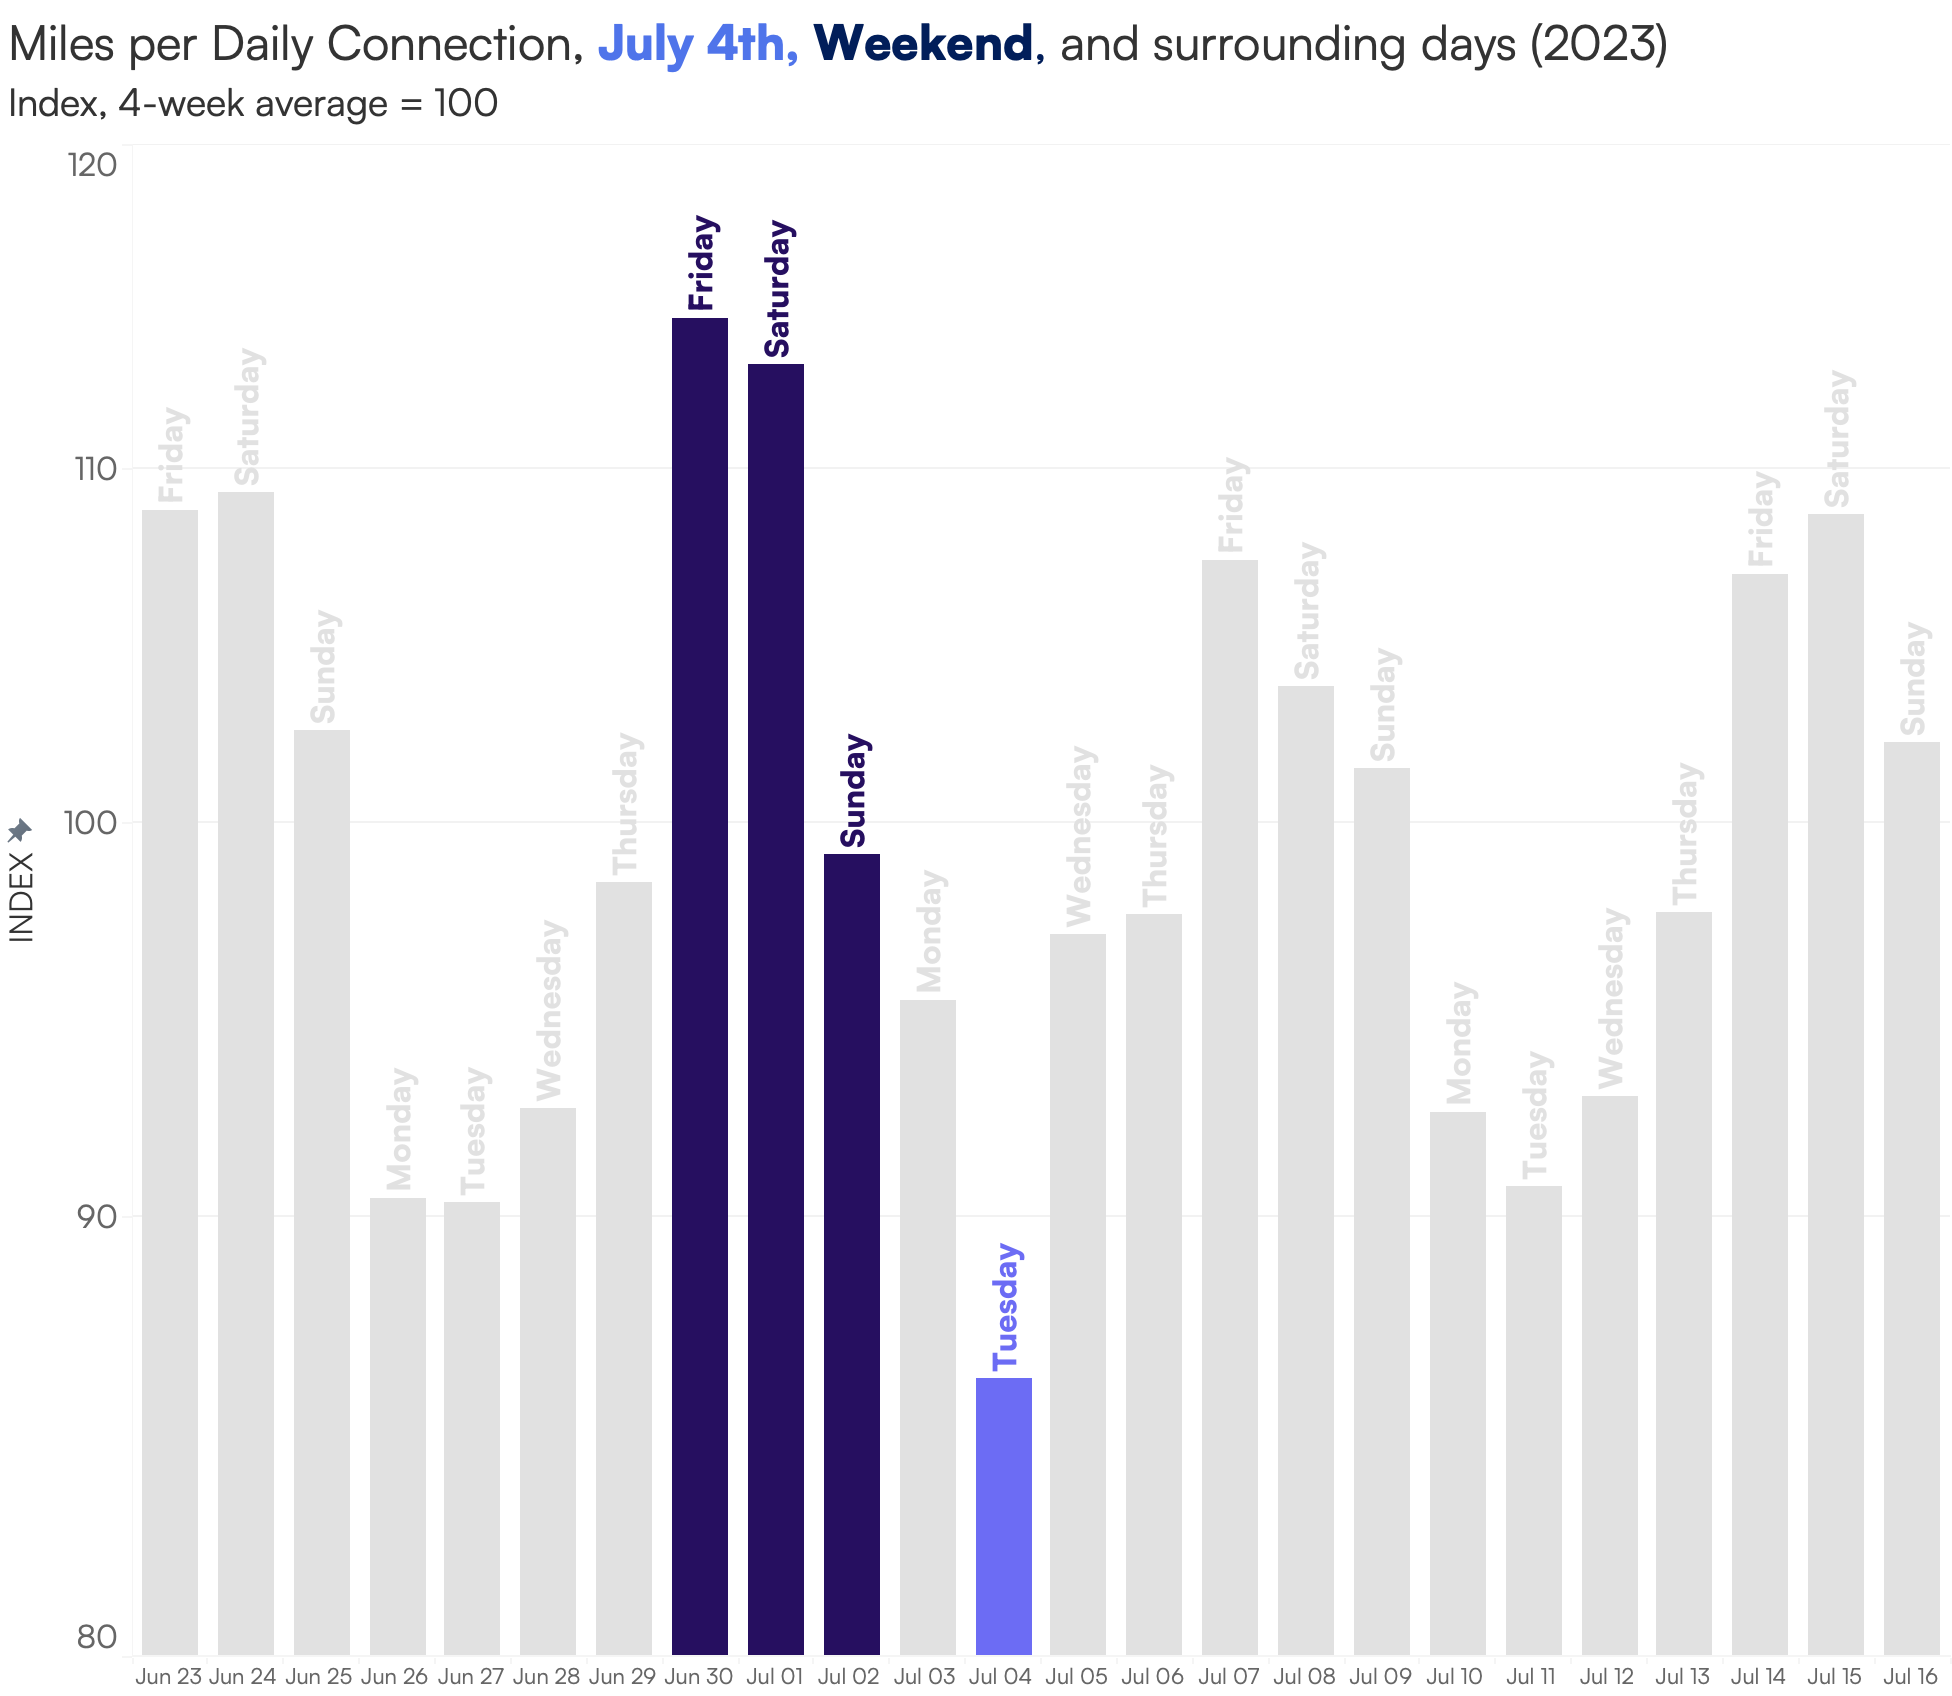
Last year, July 4th fell on a Tuesday, creating an opportunity for a long weekend if people had Monday and Tuesday off from work. Likely because of this, we saw more miles driven per person than normal the Friday and Saturday before the holiday last year – indicating that some people hit the road at their first opportunity.
Miles driven was much lower on July 4th and then elevated again on Wednesday, July 5th, indicating people travel less on the holiday, but may have headed home the day after the festivities.

This year, the holiday is falling on a Thursday, which means there’s another opportunity for a long weekend if people have Thursday and Friday off from work. If we see similar patterns this year and people hit the road as soon as they get a chance, the roads may be busier than normal the day before the holiday.
However, the holiday itself is more uncertain. While people might hit the roads on their first day off from work, people also may opt to stay in for the holiday – both of which are patterns we saw in last year’s data.
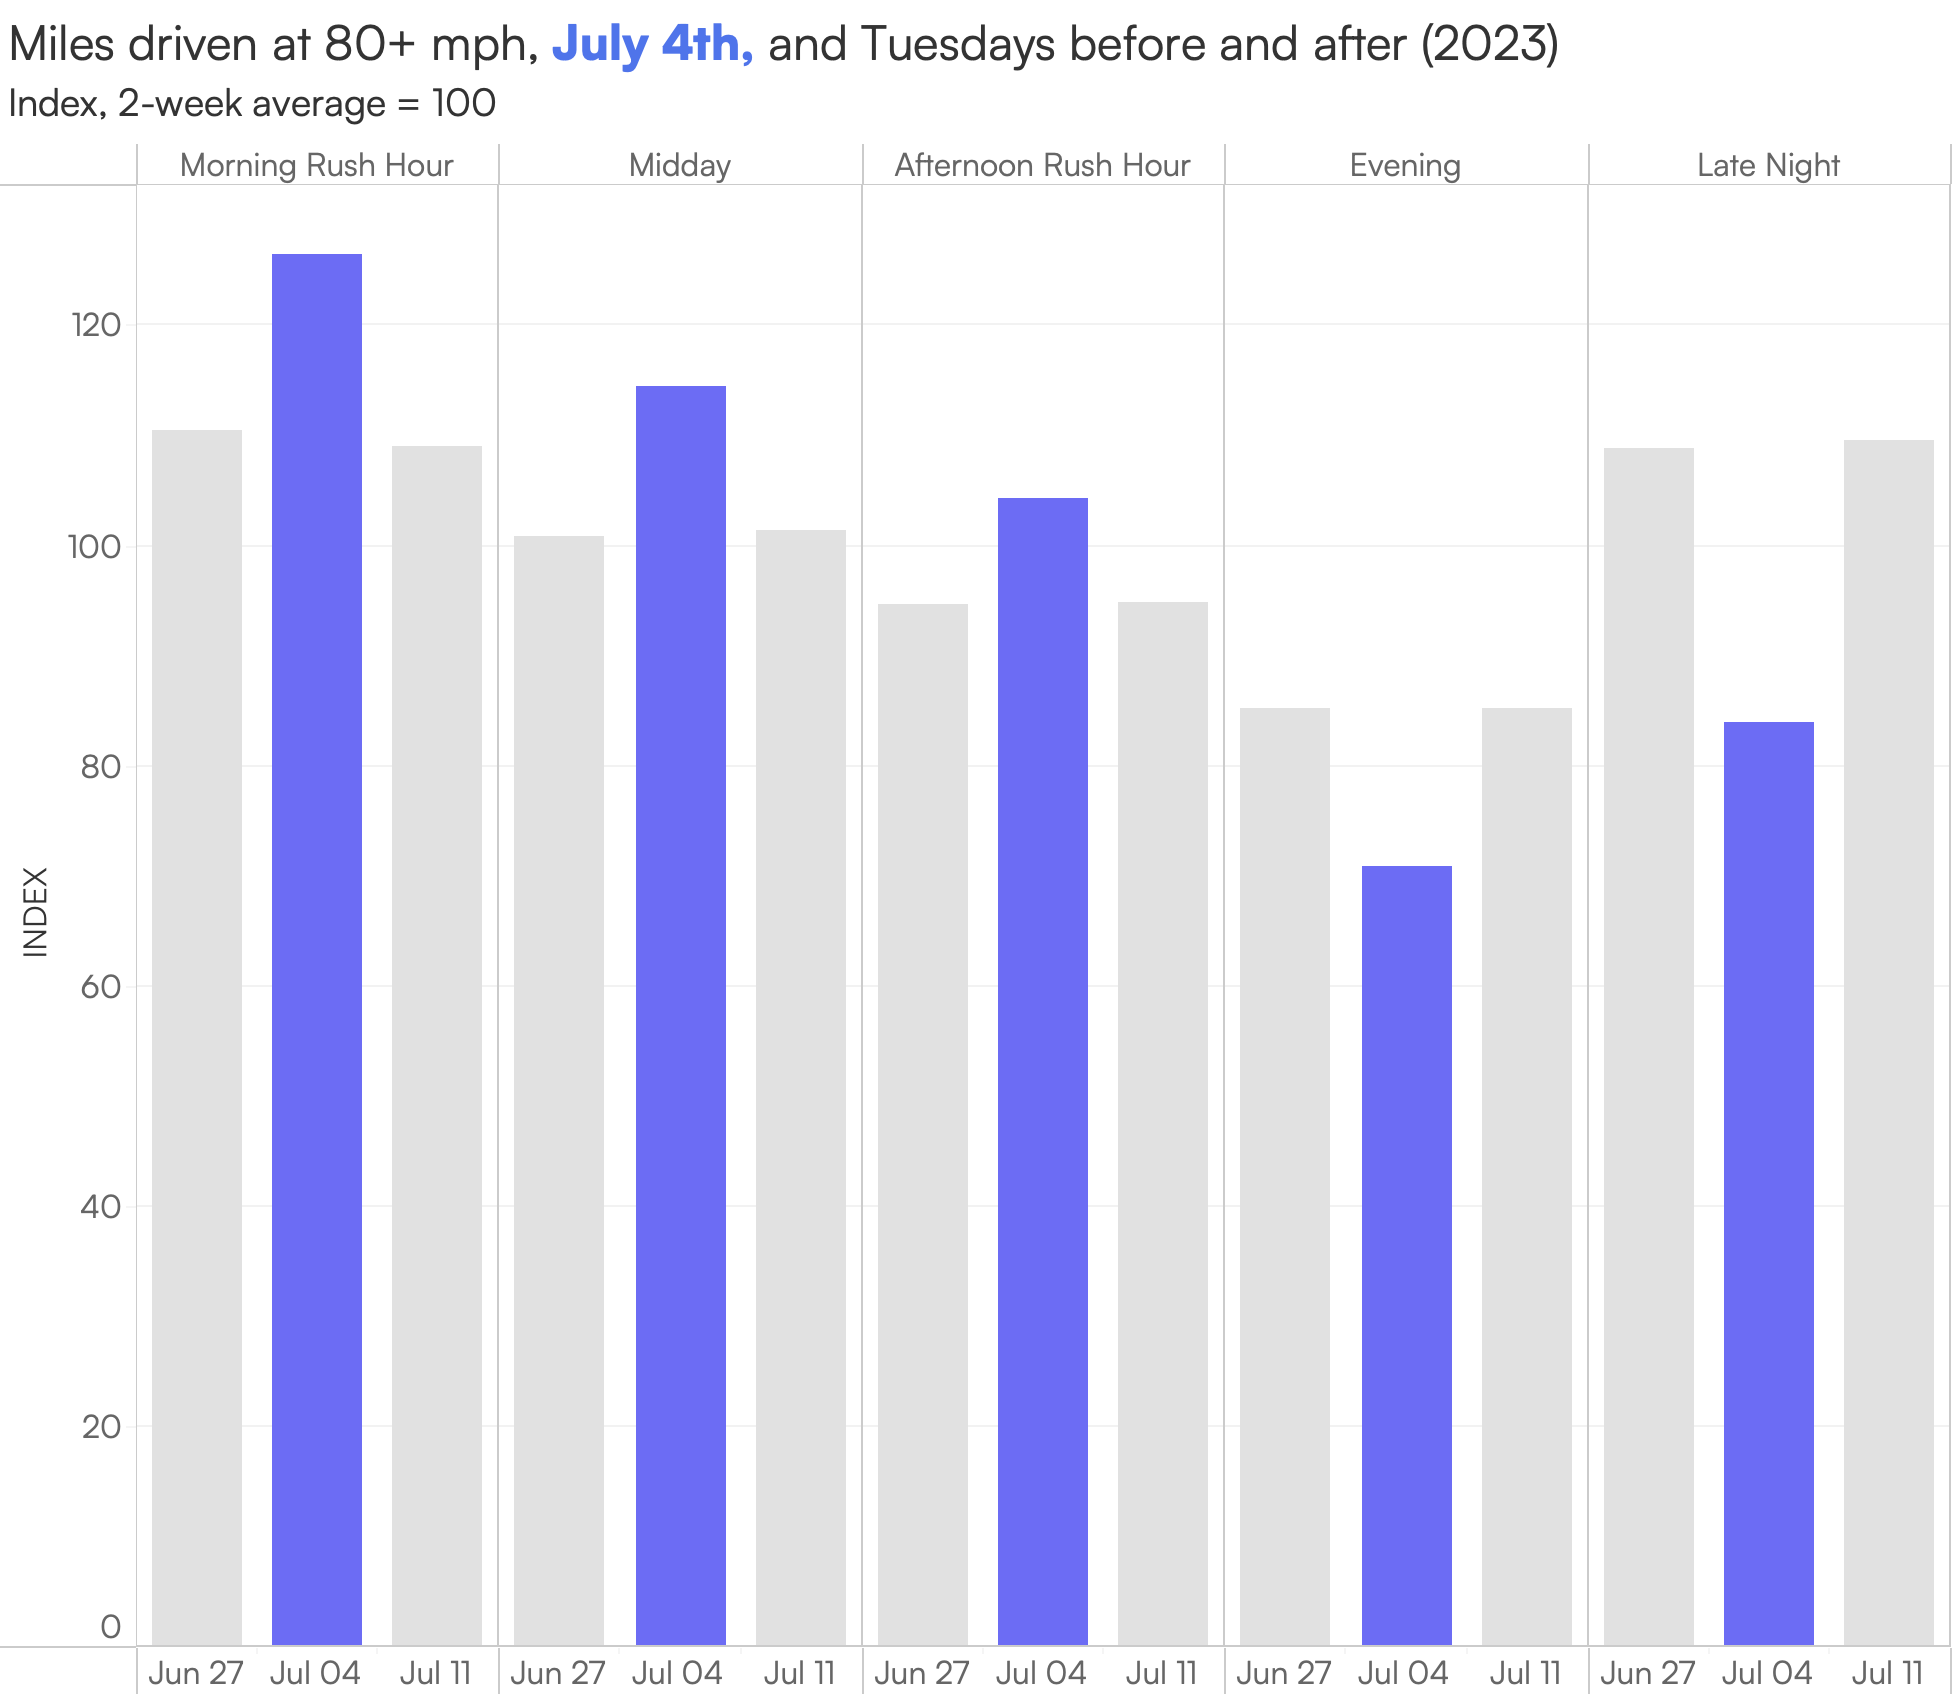
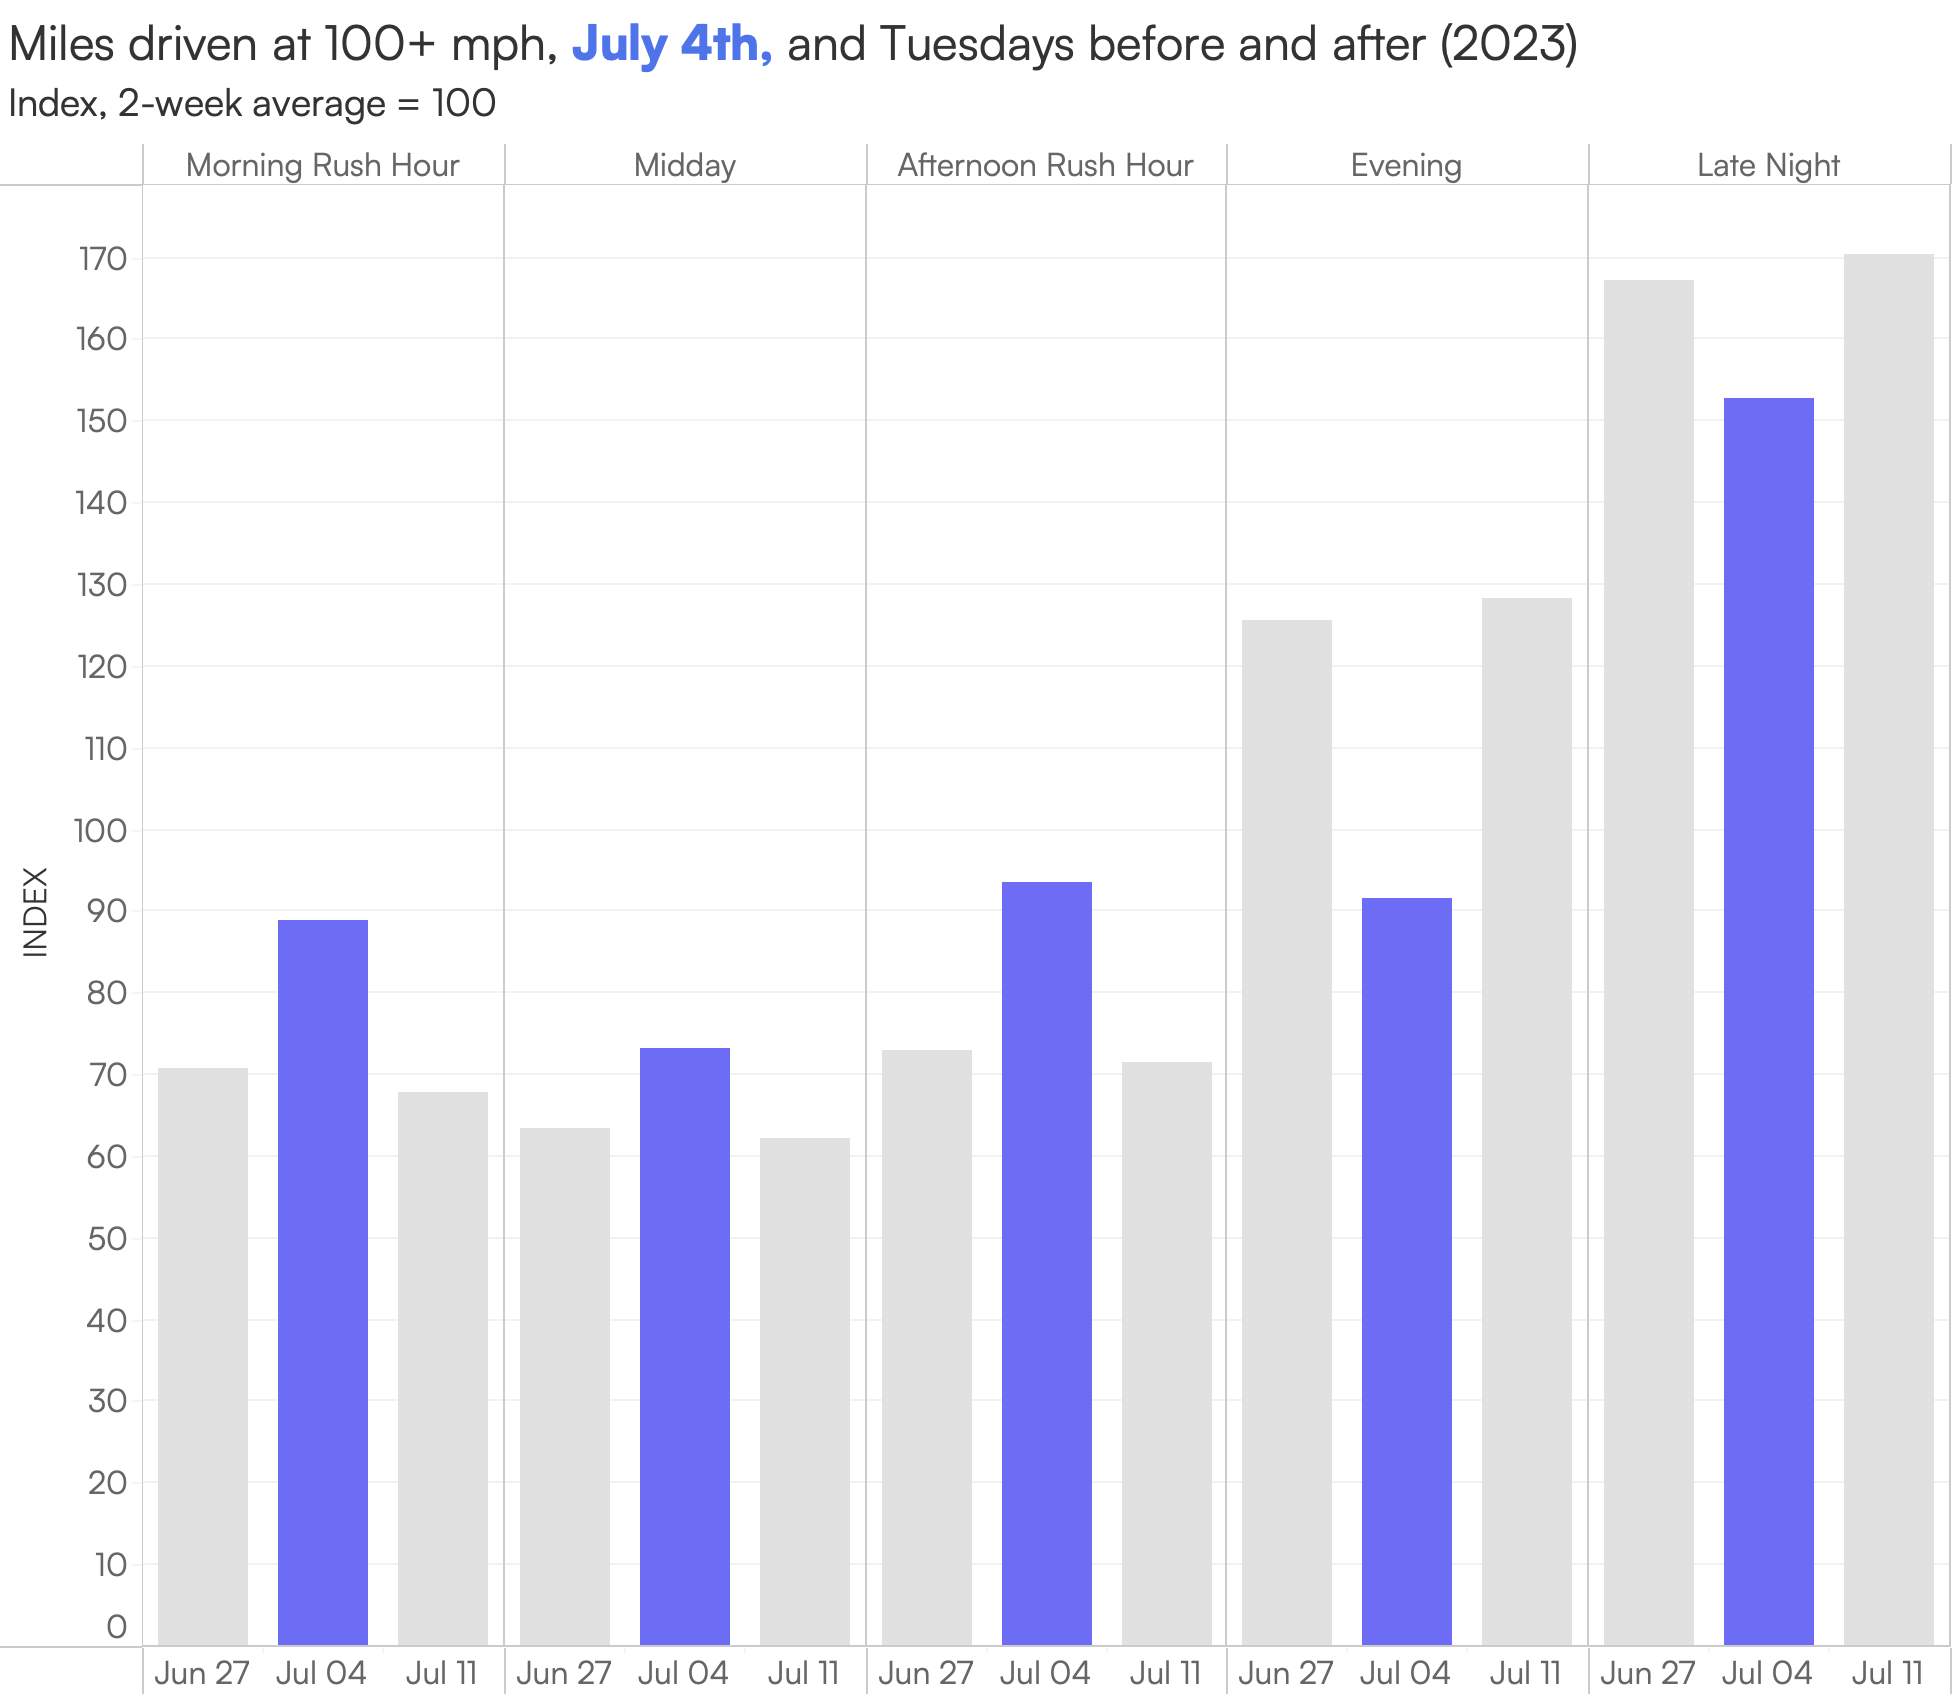
In 2023, we saw increased speeds on July 4th compared to normal. This dangerous driving behavior was especially prevalent during the morning rush hour from 5 a.m. – 9:59 a.m. In fact, high speeding (traveling over 80 mph) increased 44% and very high speeding (traveling over 100 mph) increased 100% during that time period.
While we typically see more high-speed driving later at night, last year July 4th started off with an uptick in speeding in the morning and remained higher than normal throughout the day, which is likely correlated to less traffic on roads.


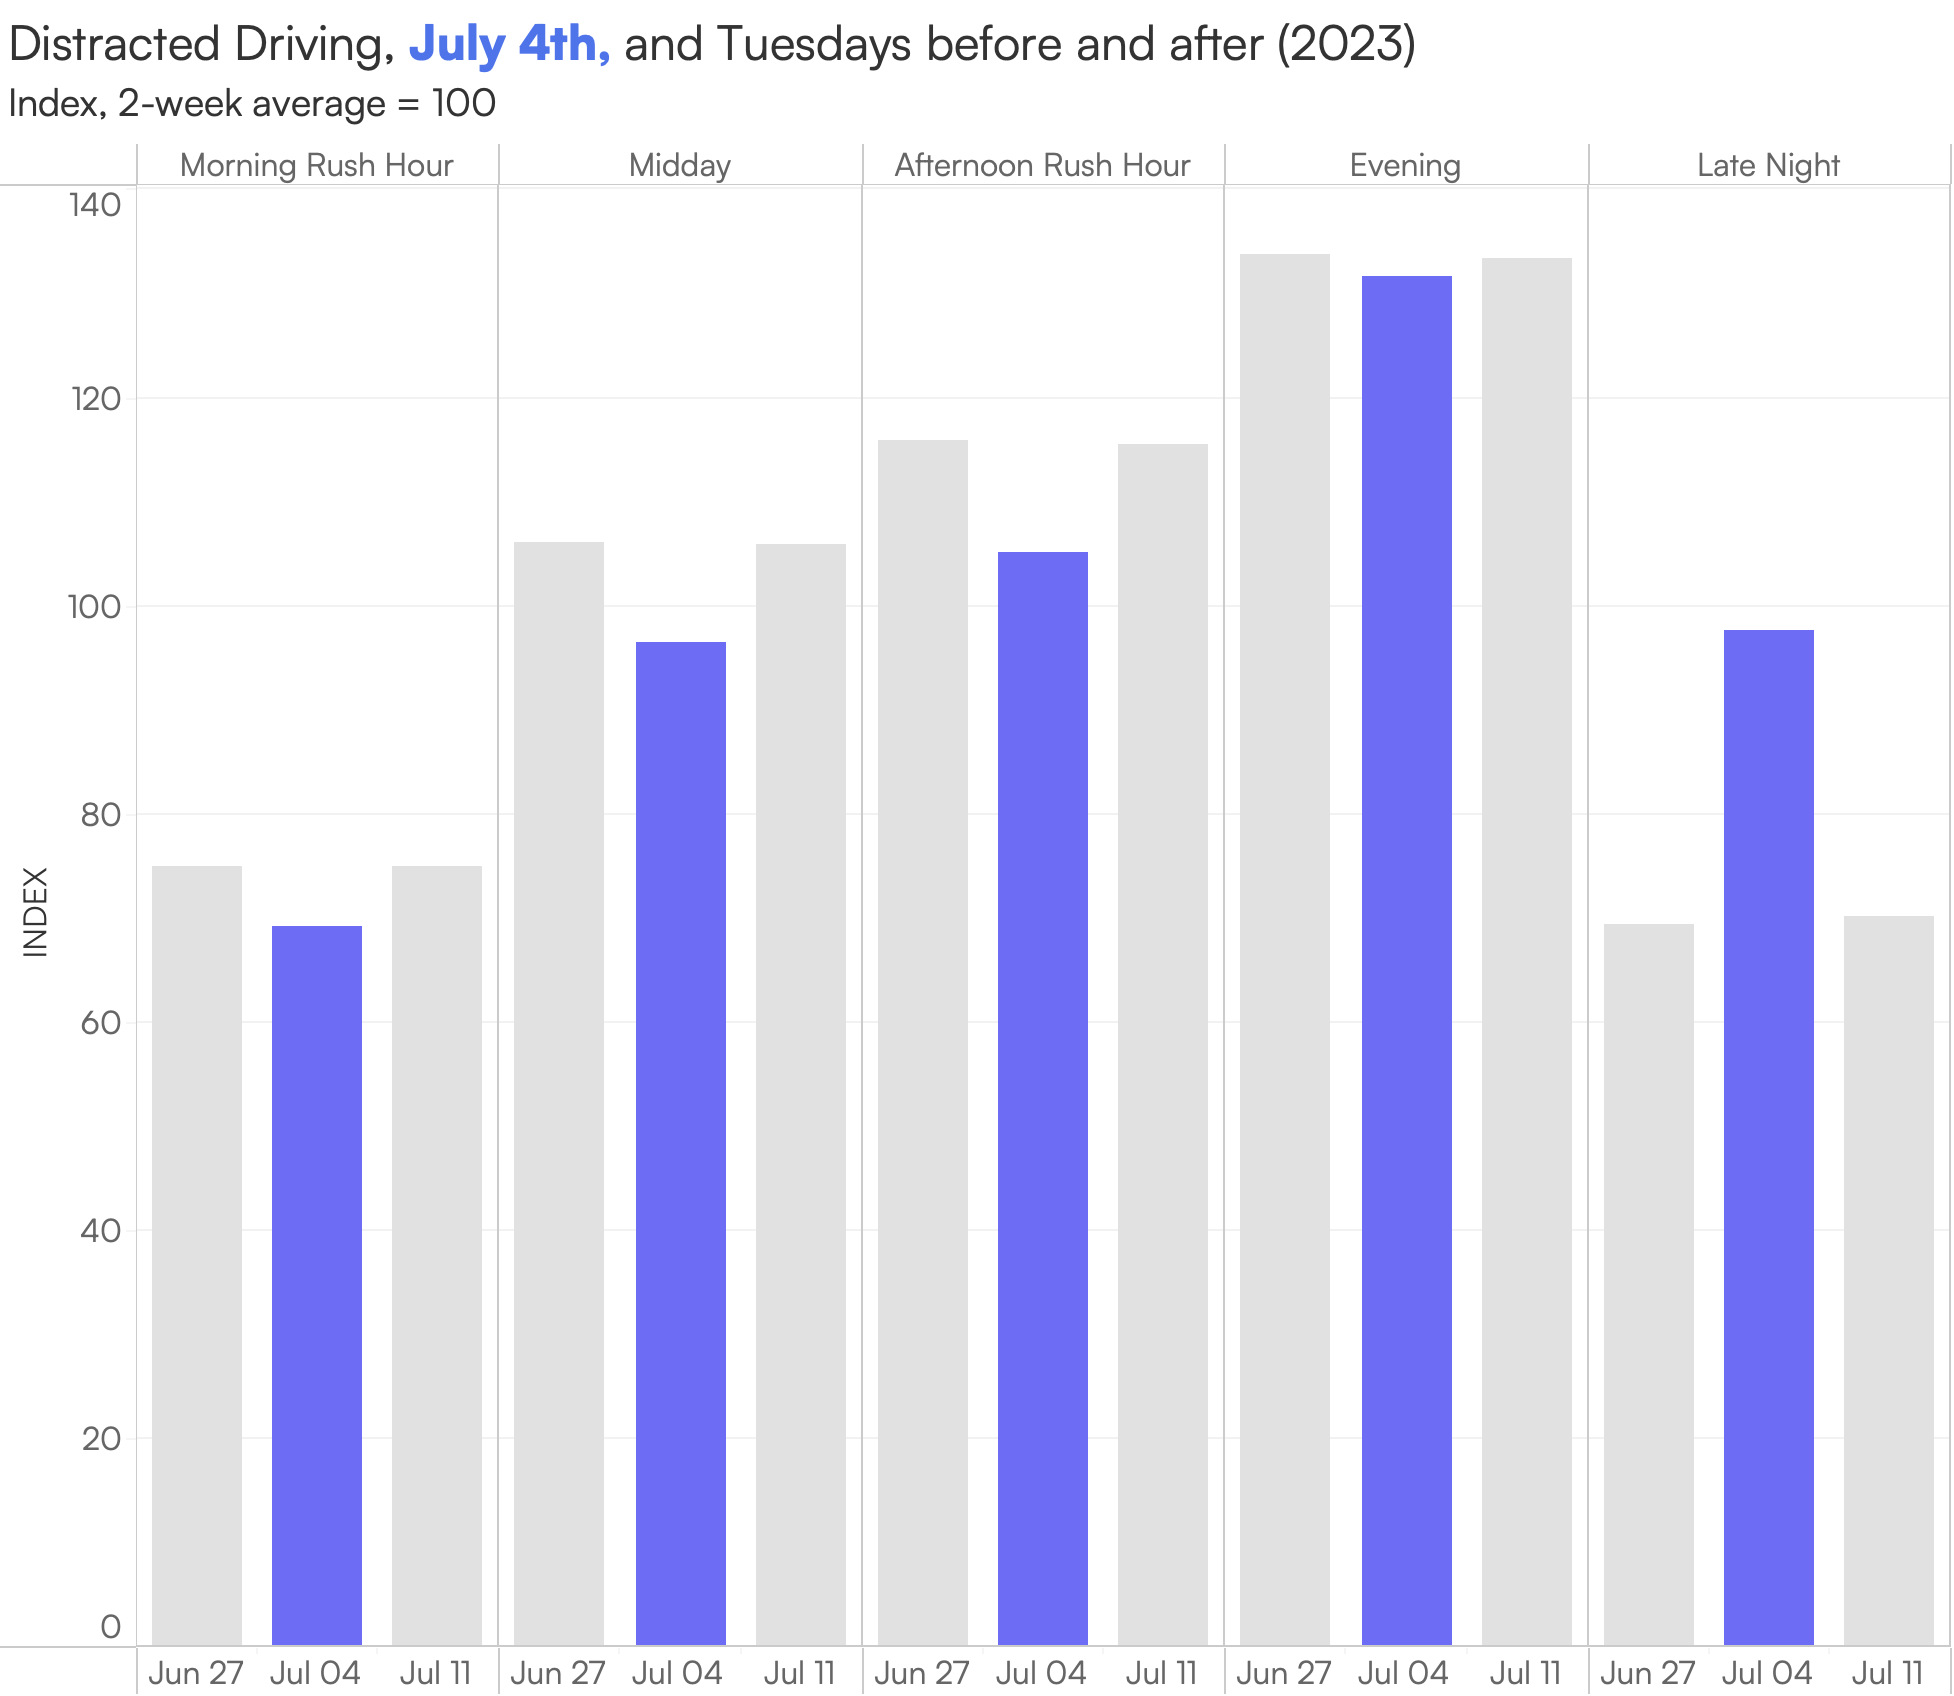
When we look at the weeks surrounding July 4th, 2023, the holiday itself saw the most distracted driving. The uptick in this risky behavior was driven solely by increased phone use during the already risky late-night period (11 – 4:59 a.m.), with a 47% increase compared to normal.

While this may be correlated to people trying to capture and record the late-night firework and drone shows, phone handling behind the wheel is a dangerous driving behavior nonetheless and increases drivers’ chance of getting into an accident.
With the world’s largest driving behavior dataset tied to insurance claims, Arity has a unique historical understanding of driving behaviors, risk, and outcomes. And as holidays, special events, and unexpected incidents inevitably disrupt how we all get from Point A to Point B, we strive to empower people, businesses, and government agencies with the insights needed to manage those shifts.
Want to learn more? Check out this blog with an update on what’s happening on our roadways from our President Gary Hallgren.
Arity’s multi-source dataset with more than 40 million active connections includes anonymized and aggregated driving behavior data collected through consumer mobile apps, insurance telematics, and on-board device (OBD) programs.
Because the data is from multiple insurance and non-insurance sources and is not solely reflective of any Arity affiliate companies or any other particular industry or source, we really get a sense of how people are moving, where they are going, when, and how. Arity is connected to millions of U.S. drivers, so we have a credible representation in every state and demographic (e.g., families, single vehicles, rural, cities).
Keep in mind that although a majority of the trips Arity collects are personal trips, we have the capability to decipher between personal trips, gig driving, and non-driving impacts.
Because Arity collects various driving behaviors within a trip, we can evaluate trends such as speeding, braking, acceleration, phone handling, and the time of day someone drives. Additionally, fueled by the largest telematics dataset tied to auto insurance claims, we can more accurately predict the impact of shifting trends in the dangerous driving behaviors that we described in this report.