As gas prices rise, driving behavior data can reveal the economic impact in real time Read article
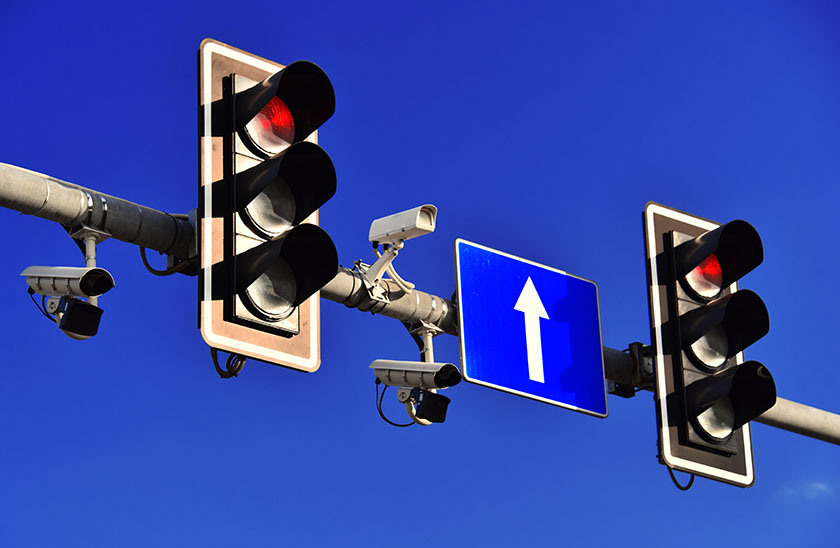
Speed enforcement cameras seem to be popping up on every corner lately. And even though they can be a nuisance to drivers, they seem to be making a positive impact on our roadways. The Washington Post reported that between February 2022 and November 2023, speeding citations decreased more than 95% on some D.C. roads with these devices.
As a native Washingtonian, I have a vested interest in local road safety. And thanks to Arity’s remote-first culture, I’m able to be a part of an analytics team that works with the world’s largest driving behavior dataset tied to insurance claims. With all of this data, Arity has a unique, historical understanding of driving behaviors, risk, and outcomes.
I took the opportunity to dive into the data, and answer the question: How do speed enforcement cameras impact driver behavior? Here’s what I found!
To answer this question, I chose a major commuter artery and a popular place for speeding. It has at least six speed enforcement cameras; I focused on three in close proximity to one another, placed along a stretch of just over two miles.
I used a bespoke tool written in Scala to collect driving behavior data from our Apache Spark environment, targeting this road during a 20-day window (October 1st – 20th,, 2023). Since locals are more likely to know where these cameras are, I started with trips originating in the D.C. metro area. Then I drew a small, specific route and created a collection of GPS points, speeds, and primary compass direction within it.
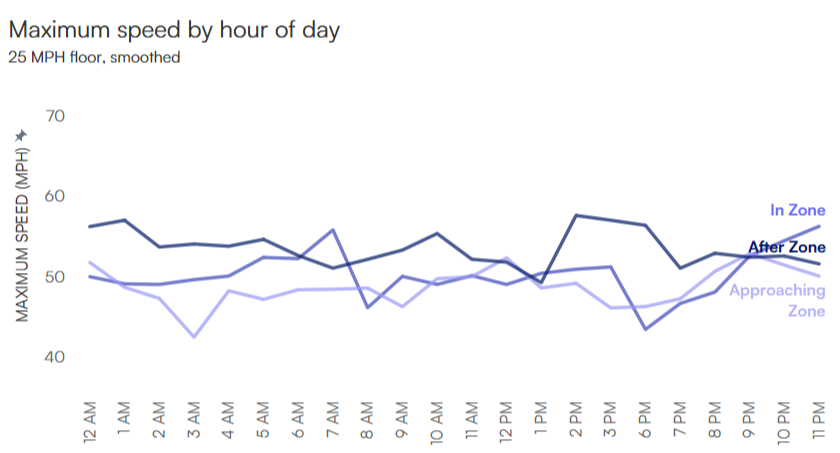
Next, I located the cameras and placed three zones around each one for “approach,” “at,” and “after” zones. I reflected the placement of road features such as camera warning signs, intersections, pedestrian crossings, bus stops, hills, etc. – things that can influence how we drive — rather than plotting strictly identical zones.
Using our driving data, I mapped each GPS point into the corresponding zone based on its location and direction. I applied a window function to each GPS trail to identify speed changes, flagging any that exceed 5% of the prior speed. I focused on speed readings equal to or greater than 25 mph because drivers stuck in traffic could artificially influence the results.
With the labels and calculations in place, I started to look for trends, noticing first that drivers are constantly increasing and decreasing their speeds.
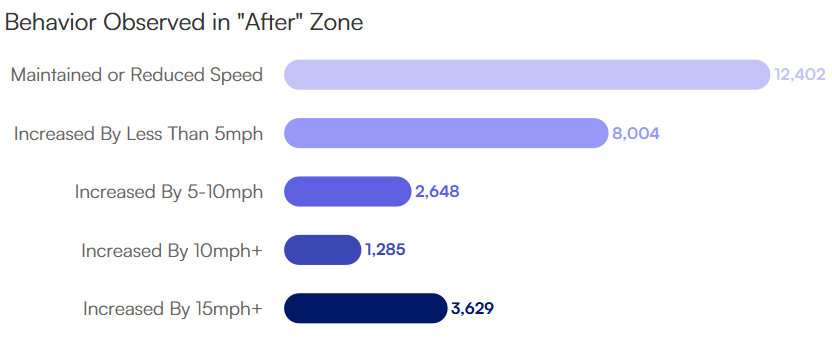
Summary: Speed enforcement cameras seem to influence many drivers, but particularly high-speed drivers. The average driver might maintain their speed or reduce it by a couple of miles per hour around a camera. However, despite continuing to speed, top speeders decelerate more dramatically – sometimes by as much as 15 mph or more.
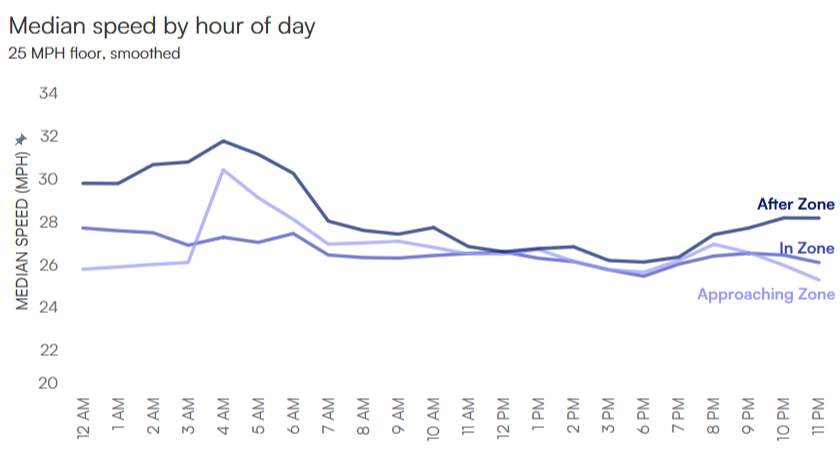
It appears that the speed enforcement cameras are accomplishing their main goal of getting people to slow down, at least while they’re in the camera zone – which means strategic placement could be key to improving overall traffic safety.
Want to learn more about Arity’s driving behavior data and insights? Check out our latest data report, “Data in action: Solving the driving safety crisis.”