How mobility data makes driving smarter and safer

Most Americans drive every day, and their driving behavior reveals stories about what’s happening in the U.S. — but only if you know where to look.
Using trillions of miles of U.S. mobility data, Arity’s Annual Driving Behavior Report looks at the last three years (2022 – 2024) and the first half of 2025 to answer the following questions:
- What are some key driving behavior benchmarks to track over time?
- How do those patterns shift in the face of unusual circumstances?
- What does this mean for individuals, businesses, and municipalities who are trying to juggle risk, mobility, and opportunity?
Let’s highlight a few of the key insights from the report, which debuted at our annual flagship conference Arity Insights, and see how they can improve outcomes for the insurance industry, the retail landscape, and the public sector.
Why Arity?
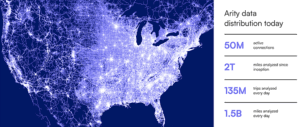
Arity amasses more than a billion miles of driving behavior data every day, and we already have more than two trillion miles in our dataset. With coverage not just of major highways but of local and non-major roads and everything in between, we can spot driving trends at scale, from the macro level all the way down to a single community.
Thanks to the depth and breadth of that mobility data, we capture the bigger picture of consumer driving behavior and how those behaviors are shifting — which leads to precise, actionable insights for individuals, businesses, and municipalities.
Key insight: Changing commuting patterns
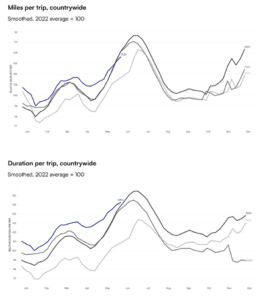
American drivers are on the road again, and return-to-office mandates are partly to blame. Nationwide, not only has mileage per trip been increasing since 2022 (up 5.1%), but the duration of each trip has also gone up (4.7%). There are seasonal peaks, particularly spring break and summer, but year over year, the trend is towards higher mileage and more time spent in the car.
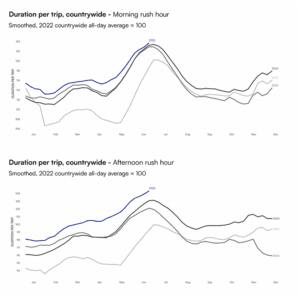
The timing of the commute has shifted as well. The morning commute is as busy as ever, but afternoons show more variability, demonstrating that workers have held onto some of that hybrid work flexibility.
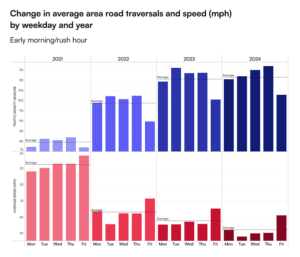
Our data also allows us to drill down to the state and local level. Using Washington state as an example, our analysts found that more people are commuting midweek, with Thursday being the busiest day.
Industry application: Retail
For retail marketers, knowing when your customers will drive past your business — and where in the country those patterns might look different — means you can provide relevant offers at the optimal time based on precise location.
Potential use case: Targeted marketing offers
- Define catchment areas with aggregated, anonymized origin/destination bounding boxes.
- Monitor weekly/monthly vehicle miles traveled and event spikes (such as a surge in long-distance trips).
- Align marketing offers and inventory to high-usage segments.
Outcomes
- Sales forecasting: When you know how many miles are being driven in an area, you can anticipate demand and reduce stocking pressures.
- Store-catchment analytics: Understanding where drivers are coming from, drive-by traffic volumes, and competitor pass-by patterns helps with site selection, marketing, and performance benchmarking.
- Segmentation and proactive targeting: Driver behavior data allows tailored marketing that reaches your customers at the right time and place.
- Customer retention: Leverage richer data for a competitive advantage in driving customer loyalty.
Key insight: Distracted driving rates are lower nationwide — but with state-level variations
In our Annual Driving Behavior Report, we noted a slight national decline in overall distracted driving rates in 2024–2025, though rates continue to spike during the winter holiday period.
When we looked at Washington state, however, distracted driving rates were consistently higher than the national average. Washington rush hour drivers were around 5% more distracted than the national average.
Industry application: Public sector
Detecting and analyzing risky driving behavior hotspots can help municipalities to pinpoint effective countermeasures and test out proactive solutions.
Potential use case: Choose and validate roadway infrastructure interventions
- Ingest driver behavior data, aggregate to road-segment level, and compute distracted driving event rates. Around 65% of Arity’s road coverage is from arterial roads, so you’ll get a fuller picture of your entire roadway system – not just highways.
- Map driving behavior events such as phone handling against existing infrastructure (intersections, crosswalks, lighting, etc.).
- Pilot a countermeasure (such as a speed camera, driver education initiatives) and measure pre-/post-event rate change.
Outcomes
- Get ahead of trouble. Understanding where risky driving behaviors occur can help with crash prevention.
- Prioritize infrastructure investment by knowing where drivers are behaving suboptimally.
- Validate the effectiveness of interventions. Driving behavior data provides real-time feedback, allowing for more timely impact measurement and strategy refinement.
- Fill data gaps. Traditional sources of roadway safety data — police crash reports, roadside traffic sensors — have well-known limitations, such as under-reporting of minor/near-miss events, uneven roadway coverage (particularly in rural/underserved areas), and time lags. Mobility data can fill many of these gaps.
Industry application: Insurance
Arity’s mobility data positions insurers to identify safe drivers early in the process — at new business or post-onboarding — so they can offer personalized pricing, improve customer retention and fairness, and better understand geographic variations.
Potential use case: More sophisticated insurance risk assessment and pricing
- Link driving behavior data such as distracted driving events to historical claims to build behavior/loss models.
- Pilot a usage-based insurance program (opt-in) to validate lift and measure claim frequency by behavior.
- Use mobility data (traffic volumes, congestion indicators) to further refine territorial pricing.
Outcomes
- Gain a more direct estimate of risk. Historically, insurers priced drivers using demographic and geographic proxies such age, gender, credit score, or ZIP code. Driving behavior data offers a more personalized and immediate context for underwriting.
- At-quote pricing: Instead of waiting for claim history, insurers can incorporate driving-behavior signals (speeding, hard braking, phone usage while driving) to estimate risk up front.
- Territorial/segment pricing: Mobility data at ZIP-code or territory level allows more granular ratemaking.
- Behavior-based rewards/incentives: Insurers can credit drivers with discounts and rewards based on safer driving.
- Claims prevention & detection: Driving event data such as phone handling not only helps pricing but also signals potential claims/risks.
Driving behavior data as a strategic asset
Keeping an eye on key mobility trends over time brings the national driving behavior picture into focus, providing fuel for businesses, insurers, and city planners to make informed strategic decisions and drive real value across a spectrum of use cases.
Arity’s Annual Driving Behavior Report highlights the dynamic nature of driving today and what that means for the key stakeholders in the transportation industry. Download it today and learn how leveraging mobility data can improve safety, increase efficiency, and create stronger connections with consumers.