Driving behavior data: The new frontier for smarter auto insurance pricing Read article


A few months ago, I wrote a blog post to call out a missed opportunity when it comes to auto insurance telematics. While it’s recognized industry-wide as a highly predictive factor of driving risk and a beneficial addition to carriers’ pricing strategies, its potential expands a lot further than that across the entire customer journey.
For this blog post, I want to start at the beginning. Before a carrier can write a policy, they need to first get people in the door (or on their website). And what if I told you telematics data – really, driving data – can be used to ensure your most valuable customers walk through that door?
As I mentioned, telematics is often viewed solely as a vehicle (pun intended 😊) to more accurately assess a driver’s risk. And this typically comes to life through a telematics program, where users are enticed with a participation discount and a promise of potentially even greater savings based on their driving performance.
This limited use of telematics isn’t very valuable to auto insurance marketers, considering it requires a pre-existing connection. It’s really “telematics data at scale,” or what we refer to as driving data history, that changes the game for marketers.
So, what does that mean?
With the world’s largest driving behavior database tied to insurance claims, Arity can help auto insurance marketers connect with customers based on how, when, and where they drive.
Arity has over 40 million (and growing) active connections to U.S. drivers, who have opted into sharing their data with us through consumer mobile apps, in-car devices, and connected cars. With our connections, auto insurance marketers can programmatically segment and target drivers based on factors like:
You may be asking yourself, “So, how exactly does this work?” Let’s take driving risk as an example. We look at drivers’ performance behind the wheel, including how often they brake suddenly, speed, or use their phones. We score these behaviors using our highly predictive Drivesight® risk score, and we group individuals into ten different risk categories. Risk category 1 drivers represent the lowest risk drivers, while risk category 10 drivers represent the highest risk drivers.
With insight into driving risks, auto insurance marketers can more specifically target the types of customers they want, depending on the insurer’s strategy. For instance:
Essentially, using driving data allows an insurer to maximize their marketing spend and target the types of drivers that align with their strategy, versus casting a wide net and attracting customers outside their intended market segment.
Driving data is an actual measure of risk. Other market segmentation factors, such as age, gender, and education level, just to name a few, are simply proxies of risk.
These approaches alone result in inefficient use of marketing dollars and generic advertising messages, like “Drivers can save an average of 20% by switching to company ABC.” These boiler plate messages typically experience low click through rates with higher per unit advertising costs, and ultimately lower policy bind rates.
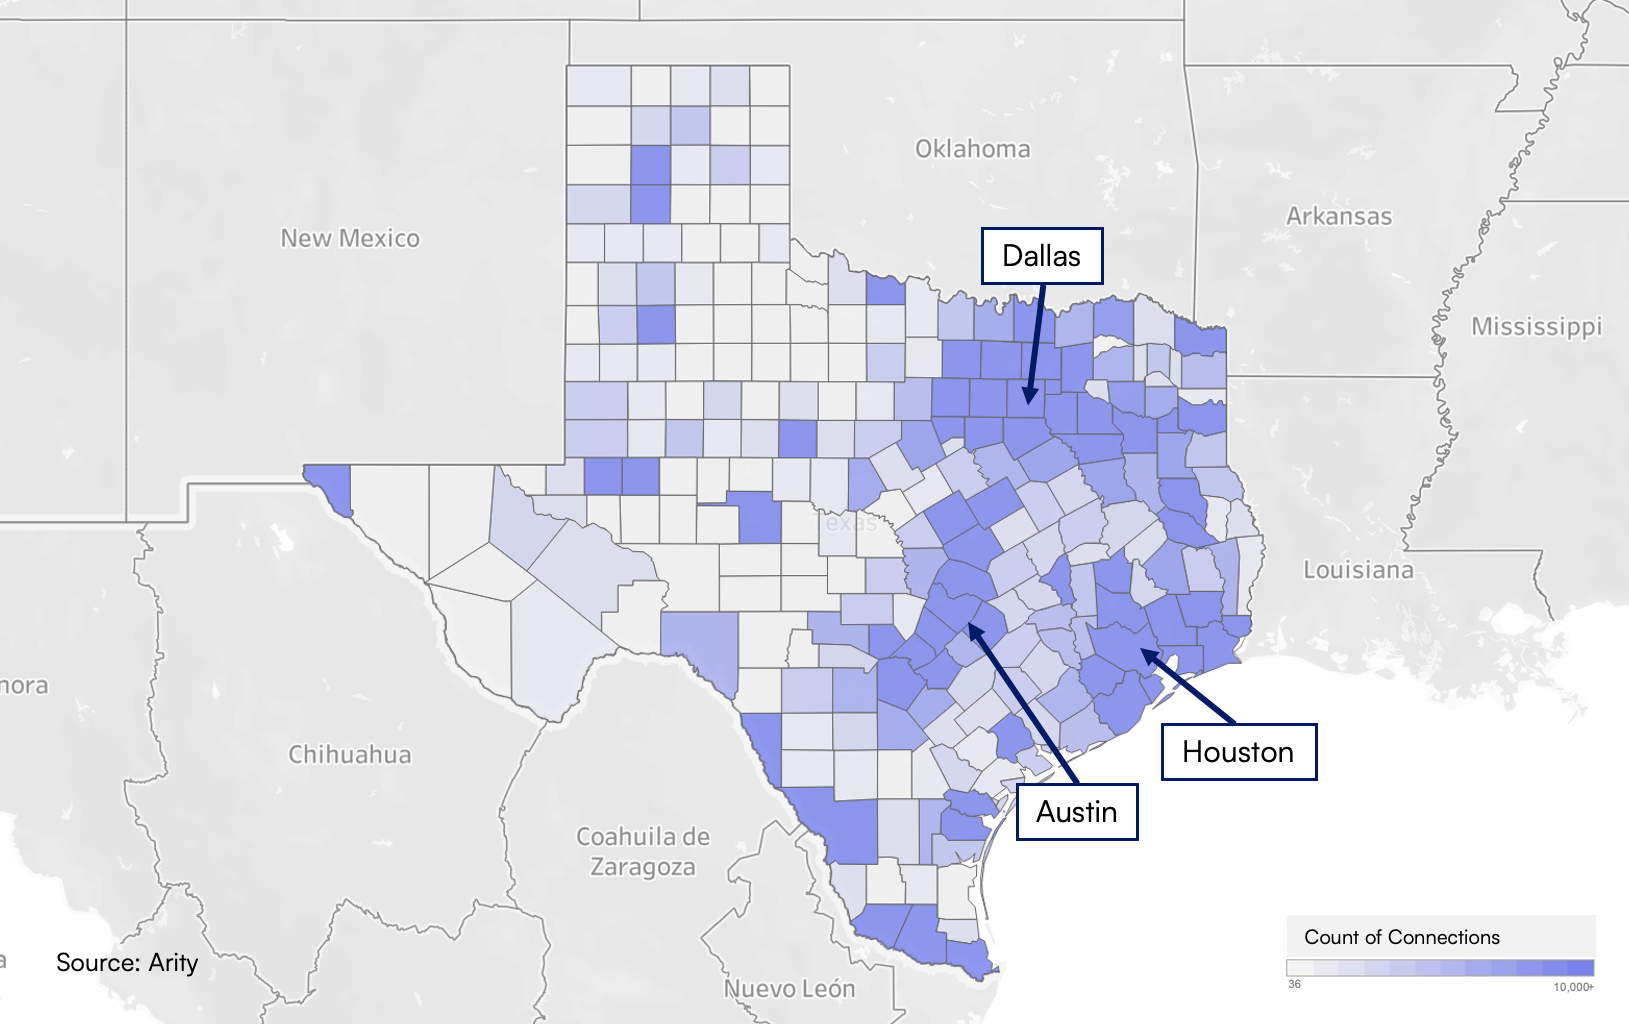
Now, imagine having the ability to target drivers, in the states you do business in, down to the zip code level! Or rolling up the segmentation to a county level to align with your agency offices. Let’s explore this a little further.

Let’s assume you sell insurance in the state of Texas. Based on Arity’s connections, an insurer can target nearly 3 million connections, which represents about 16% of all drivers in Texas. Each of these connections can be offered up digital ads, personalized based on their driver risk profile, and even customized based on geographic location down to the zip code level. It’s no longer just about the quantity of leads, but the quality of leads and delivering relevant personalized messages to more effectively sell that auto policy.
As many carriers ramp up their marketing and advertising spend (as you may have seen during the big 🏈 game), competition is growing and it’s likely going to take more effective methods of targeting to succeed in this era of increased consumer shopping and switching. Using actual driving data to advertise auto insurance might just be the competitive edge to successfully win market share in what is likely to be a hyper-competitive landscape with unprecedented levels of auto insurance shopping.
If that’s something you’re trying to achieve, reach out and let’s connect on which consumer segments make the most sense for you and your marketing goals!
Also, stay tuned for my next post in this series. I’m going to go down the customer journey and tackle how driving data can be used to offer a risk-adjusted premium at time of quote.