How risk intelligence can inform strategic decisions for insurers
Learn how driving behavior data can provide a more current view of geographic risk and support territorial pricing analysis, portfolio monitoring, and insurance decision-making.
Territory is one of the most influential rating variables in personal auto insurance. A vehicle’s garaging address reflects the driving environment around it: congestion, commuting patterns, road conditions, weather exposure, theft risk, and how other drivers on those same roads behave. When territorial pricing is accurate, premiums can better reflect expected loss cost and support competitive positioning.
But how insurers understand the territories they cover has not kept pace with how fast driving risk changes – and Arity research indicates that observed driving behavior can provide additional insight beyond traditional territorial approaches.
Most territorial pricing relies on historical loss experience, industry benchmarks, demographic data, crash records, and broad geographic proxies such as crime statistics and population density. These inputs are valuable, but they’re backward-looking and slow to update, telling insurers only what has already happened. They don’t reflect current conditions or behaviors.
That creates a practical business problem. Local risk may shift before it shows up in loss data. Return-to-office patterns, population movement, delivery traffic, changing congestion, and new road usage patterns alter a territory’s risk profile months or years before traditional data sources catch up. For carriers, this blind spot affects underwriting confidence, marketing investments, and portfolio decisions. By the time the signal shows up in developed loss data, carriers may have already written or renewed business at rates that are not fully aligned with current risk.
Arity research suggests that aggregated driving behavior data can provide additional insight into geographic risk by demonstrating a meaningful relationship between driving behavior and insurance outcomes.
By measuring how people drive right now, insurers can develop a more current, observable, and credible view of territorial risk — one that can support pricing analysis and ongoing monitoring of geographic change.
Driving behavior can make geographic risk more explainable
One of the strongest advantages of driving behavior data: it makes intuitive sense. Auto insurance losses are tied to what happens on the road. More miles mean more exposure. Hard braking reflects aggressive, congested, or complex driving conditions. High speeds increase severity. Phone handling indicates distraction. Late-night driving brings different exposure patterns. These are risk concepts that actuaries, product leaders, underwriters, regulators, and executives generally recognize without extensive translation.
That explainability matters. Insurance pricing faces increasing pressure to be accurate and understandable. This is especially true for geographic rating, where regulators, consumers, and internal stakeholders need to understand how and why one territory differs from another.
A territorial model supported only by historical outcomes or broad proxies may be technically sound, but could be harder to justify. A territorial view supported by observed driving behavior can create a clearer link between the data and the risk.
Driving behavior data doesn’t replace traditional loss experience. It can help explain why territories differ, and why certain geographies may warrant closer review.
For executives, driving behavior data can make geographic risk easier to interpret, act on, and discuss across functions.
Driving behavior can reveal risk that current pricing doesn’t fully capture
Arity research suggests that aggregated driving behavior data is associated with geographic differences in insurance outcomes, providing an additional perspective on geographic risk. The data shows relationships between observed driving behavior and insurance outcomes in six key ways.
1. Driving behavior can correlate with loss outcomes
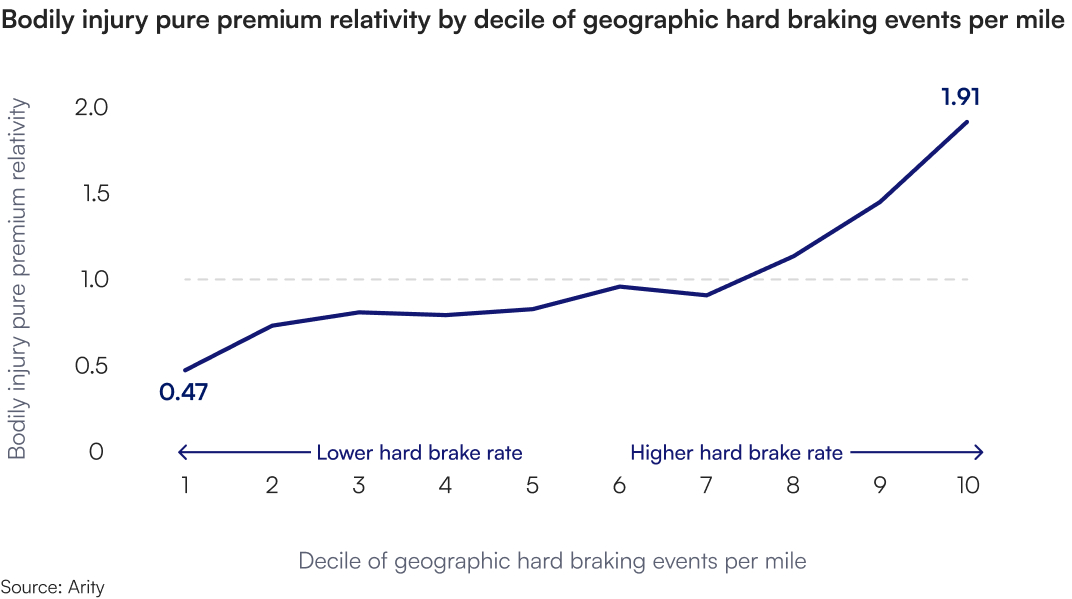
The clearest example is bodily injury. When geographies were grouped by hard braking events per mile, pure premium relativity ranged from 0.47 in the lowest hard-braking decile to 1.91 in the highest. Geographies with more hard braking were associated with higher loss costs.
This represents a business signal. If a carrier identifies geographies where observed driving behavior indicates differing levels of risk, it may be better positioned to make decisions about pricing, segmentation, and prioritization.
The result is compelling because the relationship is intuitive. Hard braking isn’t an abstract proxy. It’s an observable behavior tied to road conditions and driving risk. When geographies with more hard braking also show higher loss costs, the story is relatively straightforward to explain and defend.
2. Driving behavior can provide an additional perspective on pricing decisions.
A strong loss relationship matters, but the key question is whether driving behavior reveals something current pricing doesn’t fully capture.
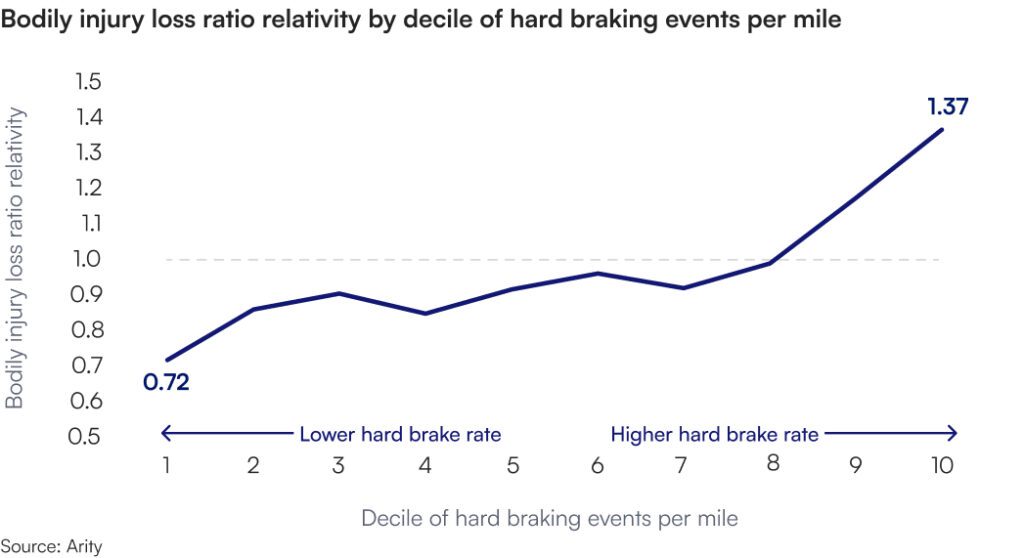
Arity research suggests that it can. Bodily injury loss ratio relativity ranged from 0.72 to 1.37 by decile of hard braking events per mile. The behavioral signal not only correlated with loss cost differences, it also highlighted geographies where current premiums may be misaligned with observed risk.
3. Driving behavior-based risk signals can apply across the portfolio
A useful territorial signal does not depend on one isolated result. Arity research shows that driving behavior segmentation can extend beyond bodily injury.
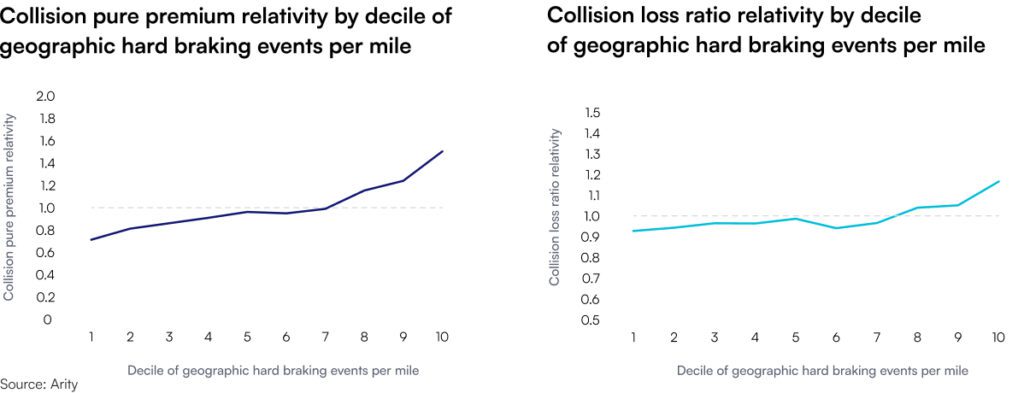
The same driving behavior signal (hard braking frequency) that was associated with bodily injury outcomes was also associated with collision outcomes. This suggests the relationship is not limited to a single coverage type and may have relevance across multiple areas of an auto insurer’s portfolio.
For collision, pure premium relativity ranged from 0.71 to 1.50 by decile of hard braking events per mile. Collision loss ratio relativity ranged from 0.92 to 1.16 on the same basis. Local driving behavior can provide insight across multiple parts of the auto insurance book.
Territorial decisions don’t affect just one metric. They influence pricing confidence, competitiveness, segmentation strategy, portfolio management, and market planning. A behavior-based signal that holds across coverages can support more coordinated decisions.
4. Driving behavior can provide segmentation beyond population density
Population density has long been a useful geographic input. It makes sense: More people and vehicles usually mean more traffic interaction. But population density is still a proxy. It describes the environment. It doesn’t measure how people actually drive in it.
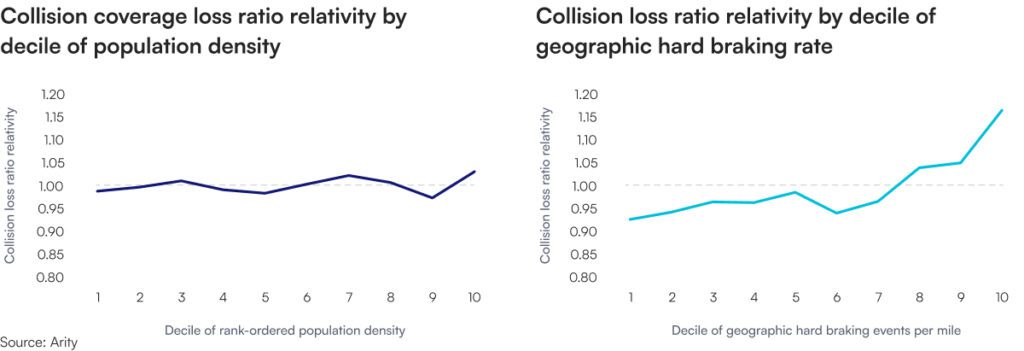
Arity research compared collision loss ratio relativities by population density and by hard braking events per mile. The population density range was nearly flat: 0.97 to 1.03. The hard braking range was wider: 0.92 to 1.16. Driving behavior does not simply restate what traditional geographic variables capture; it provides a distinct, behavior-based view of local risk.
For insurers already using common third-party data, this matters. It’s unlikely that an insurer can gain a competitive advantage from using the same proxies as everyone else; it’s in finding credible, explainable signals that show where risk is changing, can support pricing analysis, and where territorial assumptions may need a second look.
5. Driving behavior can provide a stable but responsive signal
For driving behavior data to work in practice, it should balance stability and sensitivity.
If the signal moves too much, it creates noise. If it never moves, it can’t detect emerging risk. The strongest signal aims to provide a stable baseline while still flagging significant shifts where local conditions are changing.
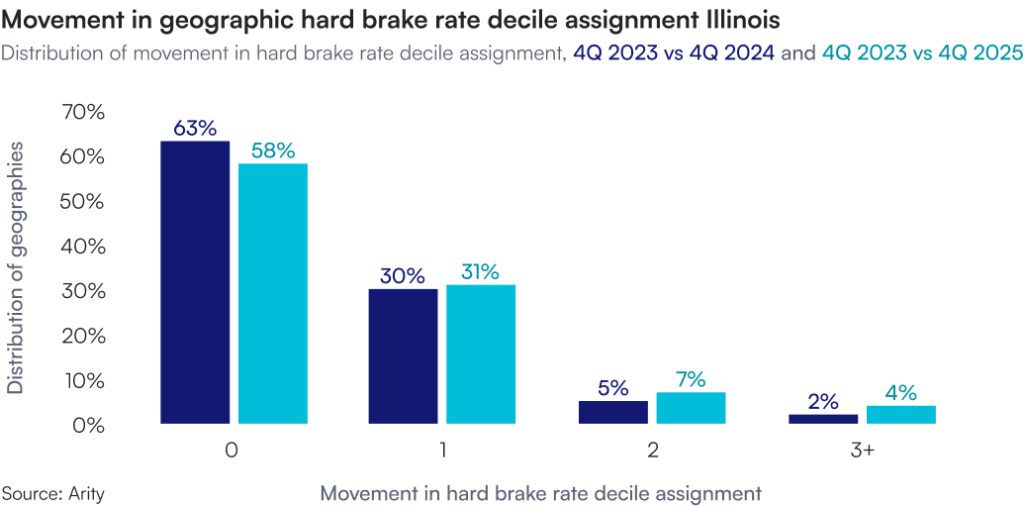
Arity products are designed to maintain that balance. In one analysis, 63% of geographies stayed in the same hard braking decile over one year, while 30% moved by one decile. Over two years, 58% stayed in the same decile and 31% moved by one.
That is, most geographies remain generally stable. But a meaningful subset shifts over time. Those shifts can provide additional context to inform future pricing, underwriting, or portfolio decisions.
Note: Results are based on the geographies included in the study period and may vary across markets.
6. Driving behavior data can fill the gap where insurance data is thin
Thin data is one of the persistent constraints in territorial pricing. It affects smaller carriers, regional insurers, rural geographies, expansion markets, and low-volume ZIP codes. It also affects large carriers trying to make more granular decisions than their own loss history supports.
When data is thin, carriers smooth, cluster, credibility-weight, or lean on broader complements. These methods work, but they blur important local differences. Two territories might get treated the same way because claims data is limited, even if actual driving behavior in those geographies looks very different.
Aggregated driving behavior data can provide local context where a carrier’s own experience falls short. The signal reflects observed driving activity in the geography, so it may offer insight into relative risk even when internal exposure or claim volume is sparse.
For smaller and regional carriers, this can be especially relevant. They face the same pricing challenges as larger competitors with less data to work with. A broader behavior-based geographic signal can empower smaller and regional carriers when their internal data is limited.
Geosight adds a behavioral lens to territorial decisions
For insurance leaders, the takeaway is straightforward: Aggregated driving behavior data can help reveal geographic risk through actual road behavior: hard braking, speeding, mileage, phone handling, and time-of-day driving, summarized at the territory level. This behavioral view of territory can support pricing analysis, provide additional visibility into geographic risk, and help identify where risk may be changing before it appears in loss results.
Arity’s Geosight delivers aggregated driving behavior insights at the ZIP code and state level. The Geosight dataset:
- Covers mileage, speed patterns, hard braking, phone handling, and time-of-day driving with no personally identifiable information or individual-level records
- Complements the territorial workflows insurers already use
- Supports pricing analysis, thin-data geographies, assumption validation, market prioritization, and ongoing monitoring of geographic risk
- Draws on tens of millions of drivers, covers roughly 96% of populated U.S. ZIP codes, and arrives in a structured format that doesn’t require complex integration
Mobility data provides a more current signal in a fast-moving market
Territorial pricing will always require judgment. Historical loss experience, actuarial methods, credibility considerations, regulatory requirements, and business strategy will stay central to the process.
But insurers shouldn’t have to manage today’s geographic risk with only yesterday’s signals.
Aggregated driving behavior data can give carriers a more are there of how risk is forming and changing across territories.
- It’s intuitive because it reflects how people actually drive.
- It’s explainable because the connection to road risk is direct.
- It works where insurance data is thin because it provides broader geographic context.
- It’s useful for continuous monitoring because it’s stable enough for a baseline while responsive enough to flag meaningful local change.
For insurance leaders, the opportunity is to make better geographic decisions, earlier, with more confidence, and with a clearer picture of what’s happening on the road. And because these insights can inform territorial selections within existing ranges, carriers may be able to start making smarter geographic decisions before the next full filing cycle.
More current signals can inform key strategic decisions, helping carriers manage profitability better, compete more effectively, and respond to risk shifts with precision. Carriers that wait for traditional loss data alone will eventually see the same changes, but later, and usually after the business impact has already landed.
For insurers exploring how to bring a more current view of geographic risk into their territorial strategy, contact Arity.
Learn more about risk intelligence
About Arity
Arity is a mobility intelligence company focused on understanding how people move: how they drive, where they travel, and how those patterns change over time. Arity applies driving behavior data across insurance and other mobility use cases, including insights that help insurers understand driving risk.
For auto insurers, Arity translates large-scale driving behavior data into practical insights for smarter insurance decisions. With Geosight, that means giving carriers a more current, explainable, behavior-based view of geographic risk for territorial pricing and continuous monitoring.
Methodology and data sources
This paper is based on Arity research conducted in 2026 into whether aggregated driving behavior data can improve how insurers evaluate geographic risk. The analysis paired Arity driving behavior data with insurance exposure, loss, and premium data from partner carriers, then compared driving behavior patterns with insurance outcomes by geography.
These results are not a prescribed rating plan. They are not a replacement for a carrier’s actuarial process. Any territorial pricing decision still depends on the carrier’s actuarial judgment, credibility standards, internal governance, regulatory requirements, and business strategy.
Data sources
The research used three main data sources.
Arity driving behavior data. Arity’s driving behavior data captures aggregated measures of how vehicles move across geographies. The measures include mileage, hard braking, speed patterns, phone handling, and time-of-day driving.
For this analysis, Arity evaluated driving behavior at the geographic level. To compare geographies with different driving volumes, Arity converted raw behavior counts into standardized rates, such as hard braking events per mile.
The analysis did not use personally identifiable information, individual driver records, individual vehicle records, or individual trip records. Arity evaluated anonymized, aggregated geographic patterns only.
Arity’s connected driving dataset includes approximately 2.9 trillion miles as of July 2026. Geosight applies this type of aggregated driving behavior data at the ZIP code and state level and covers roughly 96% of populated ZIP codes.
Insurance data. Arity paired the driving behavior data with a three-year period of insurance exposure, loss, and premium data from partner carriers. The insurance data was sampled from multiple carriers with different target markets, underwriting companies, rating algorithms, and territorial pricing methods.
That variety means the research was not limited to one carrier’s book, one pricing structure, or one territorial approach. The analysis tested whether the driving behavior signal showed up across different insurance contexts.
Population density data. Arity also used population density from Census data as a comparison point. Population density is a common geographic proxy in territorial analysis because it is available even where a carrier has limited insurance experience.
The comparison helped answer a practical question: Does observed driving behavior separate geographic risk better than a broad place-based proxy?
Methodology
Arity grouped geographies into deciles based on hard braking events per mile. Lower deciles had lower hard braking rates. Higher deciles had higher hard braking rates.
Hard braking was used because it is an observed driving behavior, not an inferred proxy. It reflects how people are driving in a geography and can be compared across geographies when measured as a rate per mile.
After assigning geographies to deciles, Arity compared insurance outcomes across those groups. The analysis looked at two types of relativities:
- Pure premium relativity, which shows whether geographies with different driving behavior also had different observed loss costs. Arity evaluated this for bodily injury and collision coverage by hard braking decile.
- Loss ratio relativity, which shows whether the driving behavior signal identified geographic risk differences not fully reflected in current premiums. Arity evaluated this for bodily injury and collision coverage by hard braking decile.
Arity also compared collision loss ratio relativities by hard braking events per mile with collision loss ratio relativities by population density. This showed whether driving behavior produced more separation than population density alone.
Stability and responsiveness
Arity also tested whether the driving behavior signal was stable enough to be useful in territorial analysis while still responsive enough to flag local change.
To do that, Arity assigned geographies to hard braking deciles in one period, then re-deciled those same geographies in later periods. The analysis measured how much each geography moved over time.
In the one-year comparison, 63% of geographies stayed in the same decile and 30% moved by one decile. In the two-year comparison, 58% stayed in the same decile and 31% moved by one decile.